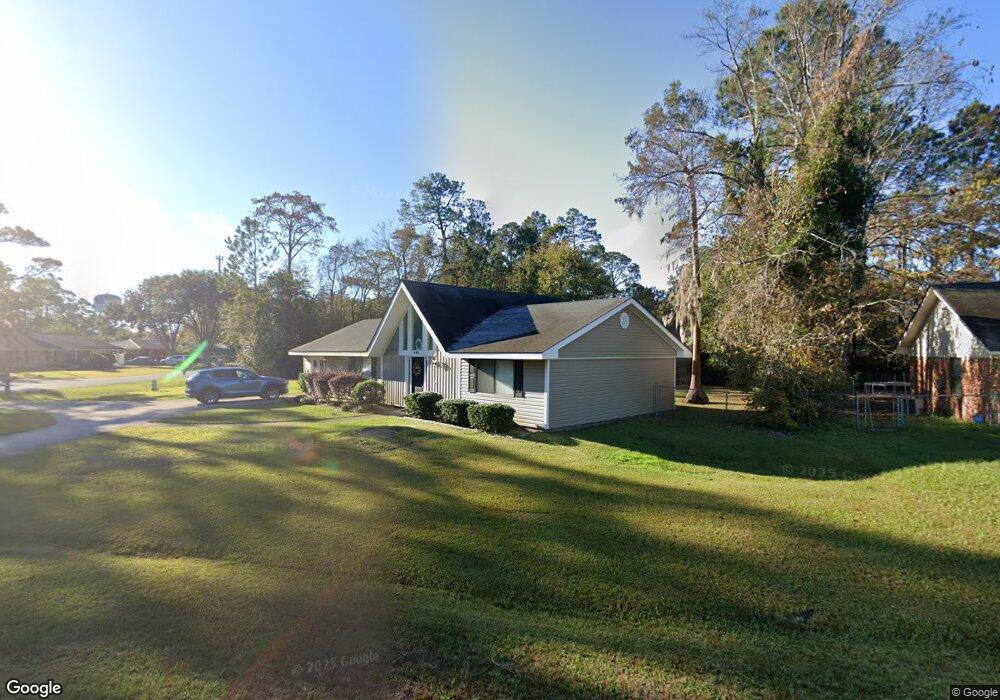
449 Elm St Hinesville, GA 31313
Estimated Value: $211,000 - $239,000
3
Beds
2
Baths
1,560
Sq Ft
$143/Sq Ft
Est. Value
About This Home
This home is located at 449 Elm St, Hinesville, GA 31313 and is currently estimated at $223,144, approximately $143 per square foot. 449 Elm St is a home located in Liberty County with nearby schools including Button Gwinnett Elementary School, Snelson-Golden Middle School, and Bradwell Institute.
Ownership History
Date
Name
Owned For
Owner Type
Purchase Details
Closed on
Oct 24, 2013
Sold by
Hendry James C
Bought by
James C Hendry Homebuil
Current Estimated Value
Home Financials for this Owner
Home Financials are based on the most recent Mortgage that was taken out on this home.
Original Mortgage
$117,472
Outstanding Balance
$87,685
Interest Rate
4.33%
Mortgage Type
VA
Estimated Equity
$135,459
Purchase Details
Closed on
Mar 5, 2013
Sold by
Sec Of Housing & Urb
Bought by
James C Hendry Homebuil
Home Financials for this Owner
Home Financials are based on the most recent Mortgage that was taken out on this home.
Original Mortgage
$60,362
Interest Rate
3.56%
Mortgage Type
New Conventional
Purchase Details
Closed on
Sep 4, 2012
Sold by
Wells Fargo Bank
Bought by
Sec Of Housing & Urban
Purchase Details
Closed on
Jan 21, 2000
Sold by
Philbrick William
Bought by
Samuels Shawn Y
Purchase Details
Closed on
Apr 22, 1988
Bought by
Philbrick William
Create a Home Valuation Report for This Property
The Home Valuation Report is an in-depth analysis detailing your home's value as well as a comparison with similar homes in the area
Home Values in the Area
Average Home Value in this Area
Purchase History
| Date | Buyer | Sale Price | Title Company |
|---|---|---|---|
| James C Hendry Homebuil | -- | -- | |
| Llaurador Rocardp Pereira | $115,000 | -- | |
| James C Hendry Homebuil | $49,800 | -- | |
| Sec Of Housing & Urban | $73,200 | -- | |
| Wells Fargo Bank | $73,200 | -- | |
| Samuels Shawn Y | -- | -- | |
| Samuels Shawn Y | $62,000 | -- | |
| Philbrick William | $4,500 | -- | |
| Philbrick William | $42,000 | -- |
Source: Public Records
Mortgage History
| Date | Status | Borrower | Loan Amount |
|---|---|---|---|
| Open | Llaurador Rocardp Pereira | $117,472 | |
| Closed | James C Hendry Homebuil | $117,472 | |
| Previous Owner | James C Hendry Homebuil | $60,362 |
Source: Public Records
Tax History Compared to Growth
Tax History
| Year | Tax Paid | Tax Assessment Tax Assessment Total Assessment is a certain percentage of the fair market value that is determined by local assessors to be the total taxable value of land and additions on the property. | Land | Improvement |
|---|---|---|---|---|
| 2024 | $2,715 | $80,255 | $14,000 | $66,255 |
| 2023 | $2,715 | $61,596 | $12,000 | $49,596 |
| 2022 | $2,148 | $49,911 | $9,200 | $40,711 |
| 2021 | $2,007 | $46,085 | $9,200 | $36,885 |
| 2020 | $1,949 | $44,481 | $9,200 | $35,281 |
| 2019 | $1,958 | $44,964 | $9,200 | $35,764 |
| 2018 | $1,948 | $44,964 | $9,200 | $35,764 |
| 2017 | $1,497 | $45,468 | $9,200 | $36,268 |
| 2016 | $2,052 | $45,470 | $9,200 | $36,270 |
| 2015 | $1,985 | $39,775 | $6,800 | $32,975 |
| 2014 | $1,985 | $43,507 | $8,800 | $34,707 |
| 2013 | -- | $43,420 | $13,200 | $30,220 |
Source: Public Records
Map
Nearby Homes
- 0 County Line Rd Unit 1644022
- 0 County Line Rd Unit 18961791
- 614 Demere St
- 22 Oak St
- 617 Oak St
- 489 Elm St
- 313 Deal St
- 740 Robin Hood Dr
- 731 Robin Hood Dr
- 615 Scott St
- 520 Wellington Way
- 627 Windhaven Dr
- 715 Little John Dr
- 702 Friar Tuck Ln
- 221 Heirloom Rd
- 62 Beaumont Dr
- 84 Beaumont Dr
- 66 Beaumont Dr