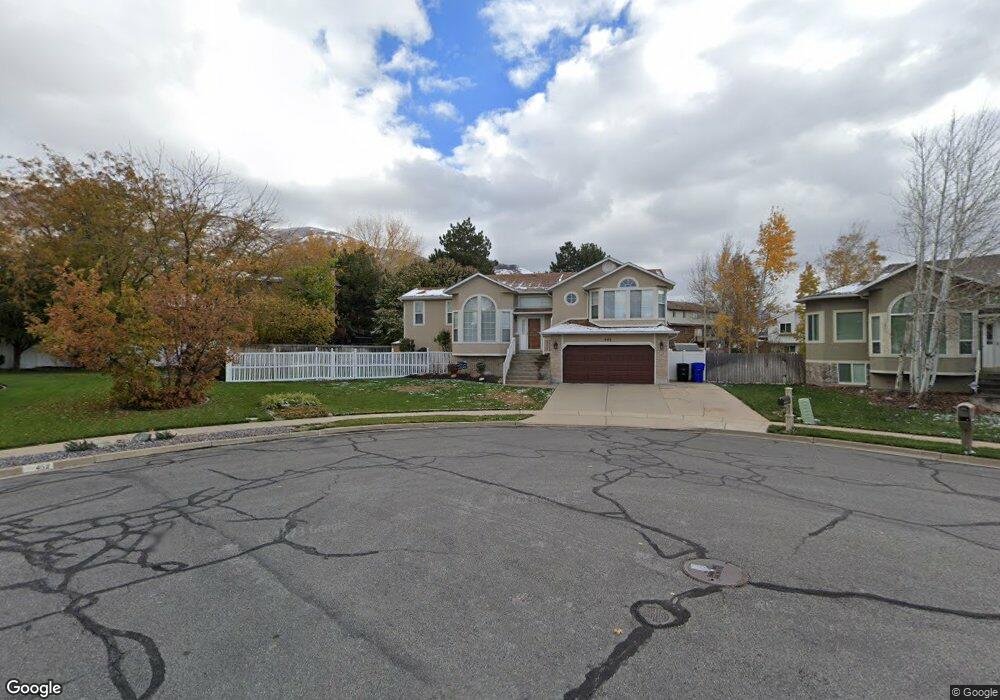
449 Fox Ct Centerville, UT 84014
Estimated Value: $637,000 - $773,000
6
Beds
3
Baths
2,800
Sq Ft
$242/Sq Ft
Est. Value
About This Home
This home is located at 449 Fox Ct, Centerville, UT 84014 and is currently estimated at $678,666, approximately $242 per square foot. 449 Fox Ct is a home located in Davis County with nearby schools including Stewart Elementary School, Centerville Jr High, and Viewmont High School.
Ownership History
Date
Name
Owned For
Owner Type
Purchase Details
Closed on
Sep 20, 2002
Sold by
Romero Christy L
Bought by
Mitchell A Scott and Mitchell Malinda
Current Estimated Value
Home Financials for this Owner
Home Financials are based on the most recent Mortgage that was taken out on this home.
Original Mortgage
$163,600
Outstanding Balance
$67,942
Interest Rate
6.16%
Estimated Equity
$610,724
Purchase Details
Closed on
Sep 16, 2002
Sold by
Campbell Christy L
Bought by
Romero Christy L
Home Financials for this Owner
Home Financials are based on the most recent Mortgage that was taken out on this home.
Original Mortgage
$163,600
Outstanding Balance
$67,942
Interest Rate
6.16%
Estimated Equity
$610,724
Purchase Details
Closed on
May 24, 1999
Sold by
Averett Ken S and Averett Cynthia
Bought by
Campbell Christy L
Home Financials for this Owner
Home Financials are based on the most recent Mortgage that was taken out on this home.
Original Mortgage
$203,300
Interest Rate
6.86%
Create a Home Valuation Report for This Property
The Home Valuation Report is an in-depth analysis detailing your home's value as well as a comparison with similar homes in the area
Purchase History
| Date | Buyer | Sale Price | Title Company |
|---|---|---|---|
| Mitchell A Scott | -- | Equity Title Agency | |
| Romero Christy L | -- | Equity Title Agency | |
| Campbell Christy L | -- | First American Title Co |
Source: Public Records
Mortgage History
| Date | Status | Borrower | Loan Amount |
|---|---|---|---|
| Open | Mitchell A Scott | $163,600 | |
| Previous Owner | Campbell Christy L | $203,300 | |
| Closed | Mitchell A Scott | $20,450 |
Source: Public Records
Tax History
| Year | Tax Paid | Tax Assessment Tax Assessment Total Assessment is a certain percentage of the fair market value that is determined by local assessors to be the total taxable value of land and additions on the property. | Land | Improvement |
|---|---|---|---|---|
| 2025 | $3,803 | $342,100 | $172,128 | $169,972 |
| 2024 | $3,631 | $333,850 | $154,858 | $178,992 |
| 2023 | $3,433 | $315,150 | $139,604 | $175,545 |
| 2022 | $3,616 | $608,000 | $233,104 | $374,896 |
| 2021 | $3,210 | $461,000 | $195,837 | $265,163 |
| 2020 | $2,843 | $407,000 | $191,225 | $215,775 |
| 2019 | $2,857 | $402,000 | $191,515 | $210,485 |
| 2018 | $2,687 | $367,000 | $177,700 | $189,300 |
| 2016 | $2,310 | $180,895 | $57,116 | $123,779 |
| 2015 | $2,243 | $166,320 | $57,116 | $109,204 |
| 2014 | $1,990 | $151,270 | $57,116 | $94,154 |
| 2013 | -- | $156,118 | $51,728 | $104,390 |
Source: Public Records
Map
Nearby Homes
Your Personal Tour Guide
Ask me questions while you tour the home.