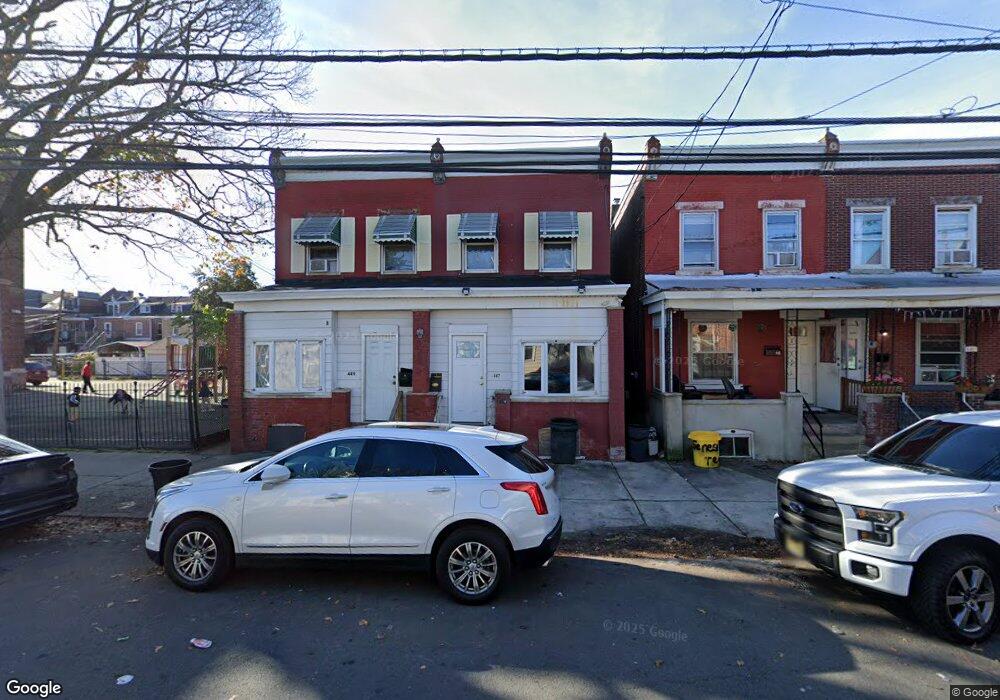
449 Genesee St Trenton, NJ 08611
Chambersburg NeighborhoodEstimated Value: $126,000 - $212,000
--
Bed
--
Bath
1,278
Sq Ft
$137/Sq Ft
Est. Value
About This Home
This home is located at 449 Genesee St, Trenton, NJ 08611 and is currently estimated at $174,915, approximately $136 per square foot. 449 Genesee St is a home located in Mercer County with nearby schools including Harrison Elementary School, Monument Elementary School, and Dr. Crosby Copeland Elementary School.
Ownership History
Date
Name
Owned For
Owner Type
Purchase Details
Closed on
Mar 20, 2024
Sold by
231 Fulton Realty Llc
Bought by
Cohen Braha
Current Estimated Value
Purchase Details
Closed on
Dec 18, 2018
Sold by
71 S Clinton Llc
Bought by
231 Fulton Realty Llc
Purchase Details
Closed on
Nov 4, 2015
Sold by
Ford Virginia T
Bought by
Macwcp Iv Corp
Home Financials for this Owner
Home Financials are based on the most recent Mortgage that was taken out on this home.
Interest Rate
3.76%
Create a Home Valuation Report for This Property
The Home Valuation Report is an in-depth analysis detailing your home's value as well as a comparison with similar homes in the area
Home Values in the Area
Average Home Value in this Area
Purchase History
| Date | Buyer | Sale Price | Title Company |
|---|---|---|---|
| Cohen Braha | $125,000 | Dekel Abstract | |
| Cohen Braha | $125,000 | Dekel Abstract | |
| 231 Fulton Realty Llc | $42,000 | Successful Abstract | |
| Macwcp Iv Corp | -- | -- |
Source: Public Records
Mortgage History
| Date | Status | Borrower | Loan Amount |
|---|---|---|---|
| Previous Owner | Macwcp Iv Corp | -- |
Source: Public Records
Tax History Compared to Growth
Tax History
| Year | Tax Paid | Tax Assessment Tax Assessment Total Assessment is a certain percentage of the fair market value that is determined by local assessors to be the total taxable value of land and additions on the property. | Land | Improvement |
|---|---|---|---|---|
| 2025 | $2,970 | $51,200 | $9,000 | $42,200 |
| 2024 | $2,850 | $51,200 | $9,000 | $42,200 |
| 2023 | $2,850 | $51,200 | $9,000 | $42,200 |
| 2022 | $2,795 | $51,200 | $9,000 | $42,200 |
| 2021 | $2,843 | $51,200 | $9,000 | $42,200 |
| 2020 | $2,834 | $51,200 | $9,000 | $42,200 |
| 2019 | $2,788 | $51,200 | $9,000 | $42,200 |
| 2018 | $2,669 | $51,200 | $9,000 | $42,200 |
| 2017 | $2,537 | $51,200 | $9,000 | $42,200 |
| 2016 | $4,717 | $82,000 | $17,900 | $64,100 |
| 2015 | $4,701 | $82,000 | $17,900 | $64,100 |
| 2014 | $4,429 | $82,000 | $17,900 | $64,100 |
Source: Public Records
Map
Nearby Homes