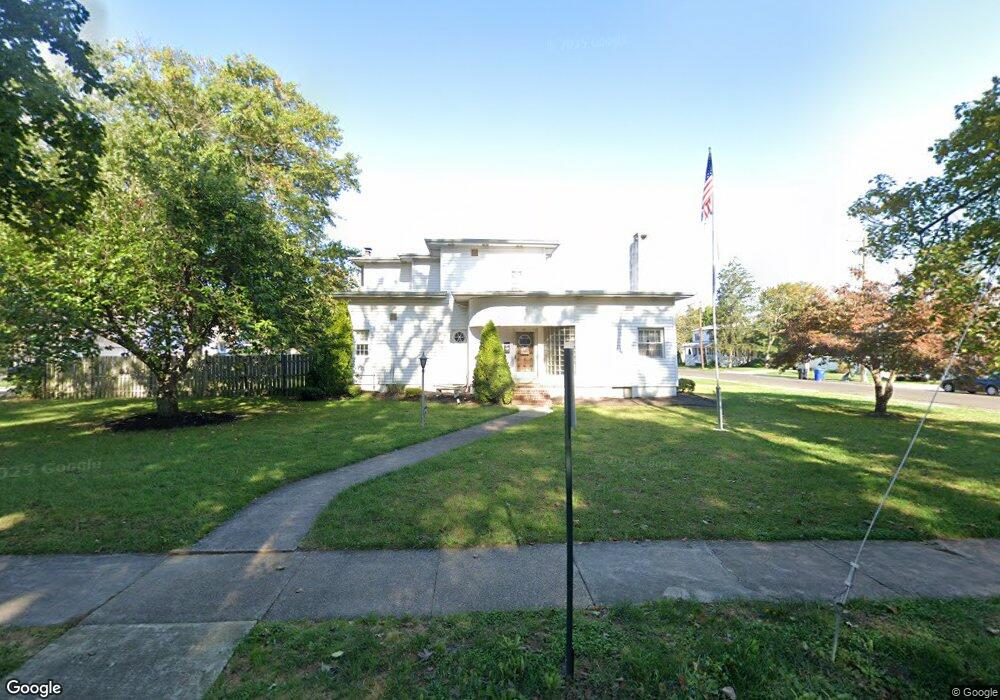
449 Grape St Hammonton, NJ 08037
Estimated Value: $381,217 - $532,000
Studio
--
Bath
2,436
Sq Ft
$187/Sq Ft
Est. Value
About This Home
This home is located at 449 Grape St, Hammonton, NJ 08037 and is currently estimated at $456,054, approximately $187 per square foot. 449 Grape St is a home located in Atlantic County with nearby schools including Hammonton Early Childhood Education Center, Warren E. Sooy Jr. Elementary School, and Hammonton Middle School.
Ownership History
Date
Name
Owned For
Owner Type
Purchase Details
Closed on
Jan 22, 2001
Sold by
Crescenzo Marie K and Crescenzo Steven G
Bought by
Crescenzo Steven G
Current Estimated Value
Home Financials for this Owner
Home Financials are based on the most recent Mortgage that was taken out on this home.
Original Mortgage
$95,000
Outstanding Balance
$33,331
Interest Rate
7.39%
Estimated Equity
$422,723
Purchase Details
Closed on
Oct 1, 1996
Sold by
Parisi Mae L
Bought by
Crescenzo Marie K and Crescenzo Steven G
Purchase Details
Closed on
May 5, 1992
Sold by
Crecenzo Marie
Bought by
Parisi Mae L
Create a Home Valuation Report for This Property
The Home Valuation Report is an in-depth analysis detailing your home's value as well as a comparison with similar homes in the area
Home Values in the Area
Average Home Value in this Area
Purchase History
| Date | Buyer | Sale Price | Title Company |
|---|---|---|---|
| Crescenzo Steven G | -- | -- | |
| Crescenzo Marie K | -- | -- | |
| Parisi Mae L | -- | -- |
Source: Public Records
Mortgage History
| Date | Status | Borrower | Loan Amount |
|---|---|---|---|
| Open | Crescenzo Steven G | $95,000 |
Source: Public Records
Tax History
| Year | Tax Paid | Tax Assessment Tax Assessment Total Assessment is a certain percentage of the fair market value that is determined by local assessors to be the total taxable value of land and additions on the property. | Land | Improvement |
|---|---|---|---|---|
| 2025 | $6,429 | $233,600 | $60,600 | $173,000 |
| 2024 | $6,429 | $233,600 | $60,600 | $173,000 |
| 2023 | $6,361 | $233,600 | $60,600 | $173,000 |
| 2022 | $6,361 | $233,600 | $60,600 | $173,000 |
| 2021 | $6,384 | $233,600 | $60,600 | $173,000 |
| 2020 | $6,352 | $233,600 | $60,600 | $173,000 |
| 2019 | $6,328 | $233,600 | $60,600 | $173,000 |
| 2018 | $6,298 | $233,600 | $60,600 | $173,000 |
| 2017 | $6,209 | $233,600 | $60,600 | $173,000 |
| 2016 | $5,983 | $233,600 | $60,600 | $173,000 |
| 2015 | $5,807 | $233,600 | $60,600 | $173,000 |
| 2014 | $5,296 | $142,800 | $40,000 | $102,800 |
Source: Public Records
Map
Nearby Homes
Your Personal Tour Guide
Ask me questions while you tour the home.