


Total Views
31,883
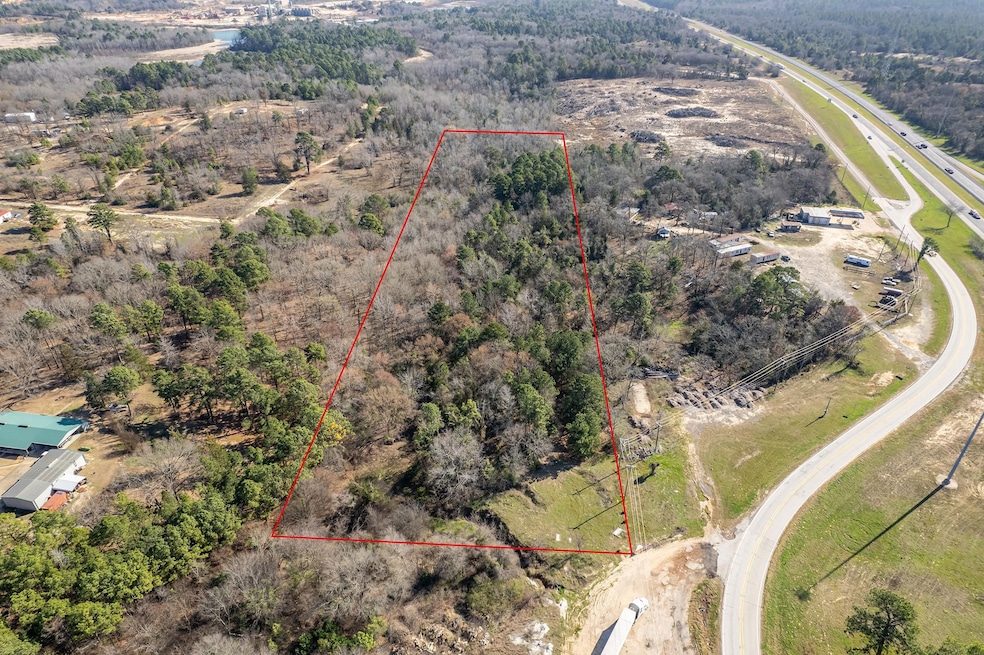
8.62
Acres
$34,223
Price per Acre
375,487
Sq Ft Lot
About This Lot
PRIME LOCATION WITH UNLIMITED POTENTIAL!
Don't miss this opportunity for 8.61 unrestricted acres with I-20 visibility in a rapidly growing area! Positioned on the northeast side of I-20 & FM 14/State Park Highway. Prime for development or investment. Perfect for businesses looking for great exposure and easy access. Ideal for commercial, residential, industrial, warehousing, storage units, RV park, truck/car wash center, restaurant, and more
Key Features:
105.83 feet of I-20 frontage access
38,000+ annual average daily traffic (TxDOT)
Unrestricted use
Owner Financing Available
Survey available, Approximate Property Dimensions 313 feet x 1196 feet
Listing Provided By

Property Details
Property Type
- Land
Lot Details
- Property fronts an interstate
- Current uses include timber
- Potential uses include commercial, industrial, residential single, timber, for development
Map
Create a Home Valuation Report for This Property
The Home Valuation Report is an in-depth analysis detailing your home's value as well as a comparison with similar homes in the area
Tax History
| Year | Tax Paid | Tax Assessment Tax Assessment Total Assessment is a certain percentage of the fair market value that is determined by local assessors to be the total taxable value of land and additions on the property. | Land | Improvement |
|---|---|---|---|---|
| 2025 | $2,263 | $141,040 | $141,040 | $0 |
| 2024 | $1,975 | $123,108 | $123,108 | $0 |
| 2023 | $1,952 | $123,108 | $123,108 | $0 |
| 2022 | $1,256 | $73,116 | $73,116 | $0 |
| 2021 | $1,336 | $73,116 | $73,116 | $0 |
| 2020 | $1,399 | $73,116 | $73,116 | $0 |
| 2019 | $1,353 | $65,844 | $65,844 | $0 |
| 2018 | $1,189 | $57,669 | $57,669 | $0 |
| 2017 | $1,211 | $57,669 | $57,669 | $0 |
| 2016 | $1,211 | $57,669 | $57,669 | $0 |
| 2015 | $1,219 | $57,669 | $57,669 | $0 |
| 2014 | $1,219 | $57,669 | $57,669 | $0 |
Source: Public Records
Property History
| Date | Event | Price | List to Sale | Price per Sq Ft |
|---|---|---|---|---|
| 07/21/2025 07/21/25 | Price Changed | $295,000 | -18.0% | -- |
| 02/26/2025 02/26/25 | For Sale | $359,930 | -- | -- |
Nearby Homes
- 430 Cr 311
- 998 County Road 311
- 12412 Fm 14
- 238 County Road 39
- 449 Interstate 20
- 13562 Cr 411 Unit Lot 3
- TBD Holtzclaw Dr Lot 42
- 13562 Cr 411 Lot 3
- TBD County Road 322 Lot 5
- TBD Holtzclaw Dr Lot 41
- 13668 Cr 411 Unit Lot 2
- 13668 Cr 411 Lot 2
- 5950 C R 486
- 0 Cr 341 Unit 26003886
- 6287 County Road 334
- 501 County Road 330
- 14662 Woodland Creek Dr
- 4451 W Unit TX 75706
- 15417 Fm 14
- 11582 County Road 35
- 12112 Fm 14
- 13523 Fm 2015 Unit Studio Apt. - Near 20 Fwy
- 9827 County Road 35
- 112 Letha Ct
- 3650 N Broadway Ave
- 11571 19th Ave
- 12277 State Highway 155 N
- 5235 Julia Dr
- 2202 W Northwest Loop 323
- 2004 N Palace Ave
- 2003 N Grand Ave Unit (Left Side)
- 2001 N Grand Ave
- 923 #1 N Tyler Ave
- 923 #4 N Tyler Ave
- 923 #2 N Tyler Ave
- 2026 N Ross Ave
- 2024 N Ross Ave
- 1804 W 24th St
- 12888 Fm 16 E Unit Studio Dome #1
- 17422 Crossing Cir
Your Personal Tour Guide
Ask me questions while you tour the home.