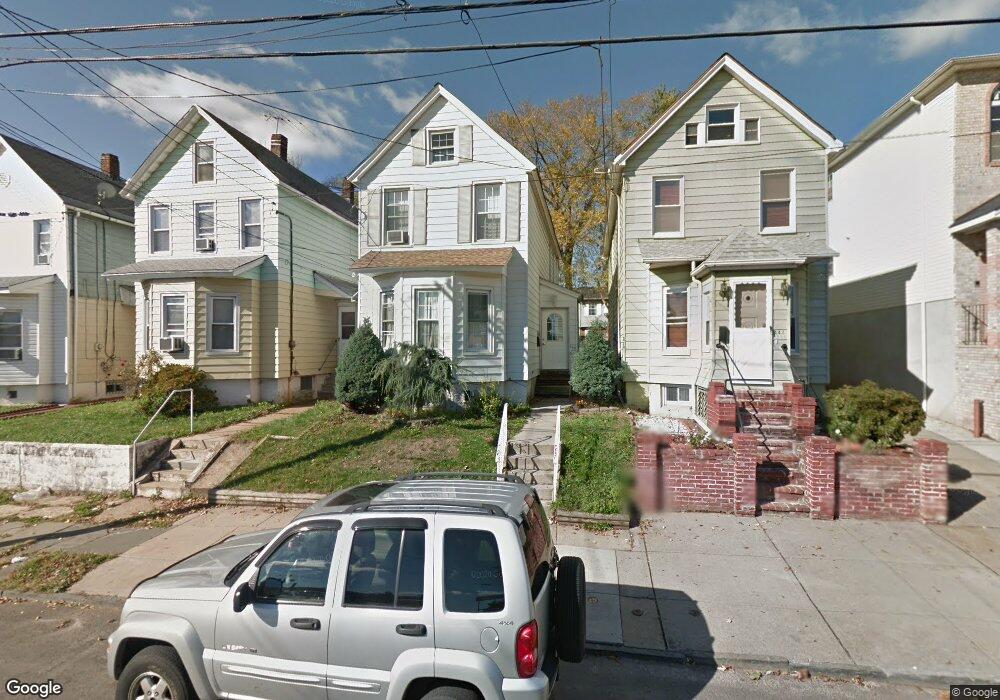
449 Maple Ave Elizabeth, NJ 07202
Bayway NeighborhoodEstimated Value: $391,000 - $556,000
4
Beds
3
Baths
1,588
Sq Ft
$305/Sq Ft
Est. Value
About This Home
This home is located at 449 Maple Ave, Elizabeth, NJ 07202 and is currently estimated at $484,722, approximately $305 per square foot. 449 Maple Ave is a home located in Union County with nearby schools including Elizabeth High School and JVJ STEM Academy - School No. 92.
Ownership History
Date
Name
Owned For
Owner Type
Purchase Details
Closed on
Aug 13, 2013
Sold by
Lituma Ariel Silvano
Bought by
Chavez Liz V De La Fuente
Current Estimated Value
Home Financials for this Owner
Home Financials are based on the most recent Mortgage that was taken out on this home.
Original Mortgage
$147,283
Outstanding Balance
$106,671
Interest Rate
3.75%
Mortgage Type
FHA
Estimated Equity
$378,051
Purchase Details
Closed on
Apr 29, 2011
Sold by
Lopez Jose F and Lopez Liz V
Bought by
Lituma Ariel Silvano
Purchase Details
Closed on
Jul 20, 2000
Sold by
Morielli Christine
Bought by
Lopez Jose F and Lopez Liz V
Home Financials for this Owner
Home Financials are based on the most recent Mortgage that was taken out on this home.
Original Mortgage
$111,912
Interest Rate
7.88%
Mortgage Type
FHA
Create a Home Valuation Report for This Property
The Home Valuation Report is an in-depth analysis detailing your home's value as well as a comparison with similar homes in the area
Home Values in the Area
Average Home Value in this Area
Purchase History
| Date | Buyer | Sale Price | Title Company |
|---|---|---|---|
| Chavez Liz V De La Fuente | $150,000 | Stewart Title Guaranty Co | |
| Lituma Ariel Silvano | $150,000 | Multiple | |
| Lopez Jose F | $107,000 | -- |
Source: Public Records
Mortgage History
| Date | Status | Borrower | Loan Amount |
|---|---|---|---|
| Open | Chavez Liz V De La Fuente | $147,283 | |
| Previous Owner | Lopez Jose F | $111,912 |
Source: Public Records
Tax History
| Year | Tax Paid | Tax Assessment Tax Assessment Total Assessment is a certain percentage of the fair market value that is determined by local assessors to be the total taxable value of land and additions on the property. | Land | Improvement |
|---|---|---|---|---|
| 2025 | $6,551 | $340,500 | $162,500 | $178,000 |
| 2024 | $8,172 | $340,500 | $162,500 | $178,000 |
| 2023 | $8,172 | $26,000 | $6,600 | $19,400 |
| 2022 | $7,951 | $26,000 | $6,600 | $19,400 |
| 2021 | $7,786 | $26,000 | $6,600 | $19,400 |
| 2020 | $7,610 | $26,000 | $6,600 | $19,400 |
| 2019 | $7,494 | $26,000 | $6,600 | $19,400 |
| 2018 | $7,421 | $26,000 | $6,600 | $19,400 |
| 2017 | $7,214 | $26,000 | $6,600 | $19,400 |
| 2016 | $7,215 | $26,000 | $6,600 | $19,400 |
| 2015 | $6,786 | $26,000 | $6,600 | $19,400 |
| 2014 | $6,582 | $26,000 | $6,600 | $19,400 |
Source: Public Records
Map
Nearby Homes
- 519 Maple Ave
- 534-536 Maple Ave
- 529 Maple Ave
- 546 S Broad St
- 558 S Broad St
- 350 Williamson St
- 840 Grove St
- 325 Grier Ave Unit 2
- 627A Britton St
- 621 Britton St
- 634 S Broad St Unit C2
- 147 Liberty St Unit 149
- 5 General Karge Ct
- 313 Washington Ave
- 859 Bayway Cir Unit 861
- 618A Clarkson Ave
- 225 S Broad St Unit 1-D
- 225 S Broad St Unit 1-E
- 614 12 4th Ave
- 328 John St
- 447 Maple Ave
- 451 Maple Ave
- 445 Maple Ave
- 453 Maple Ave
- 455 Maple Ave
- 443 Maple Ave
- 441 Maple Ave
- 457 Maple Ave
- 439 Maple Ave
- 459 Maple Ave
- 677 Garden St
- 437 Maple Ave Unit 2
- 675 Garden St Unit 4
- 675 Garden St Unit R
- 675 Garden St Unit R
- 675 Garden St Unit R
- 675 Garden St Unit 18
- 675 Garden St Unit 17
- 675 Garden St Unit 14
- 675 Garden St Unit 15
Your Personal Tour Guide
Ask me questions while you tour the home.