Estimated Value: $279,977 - $301,000
2
Beds
1
Bath
1,577
Sq Ft
$185/Sq Ft
Est. Value
About This Home
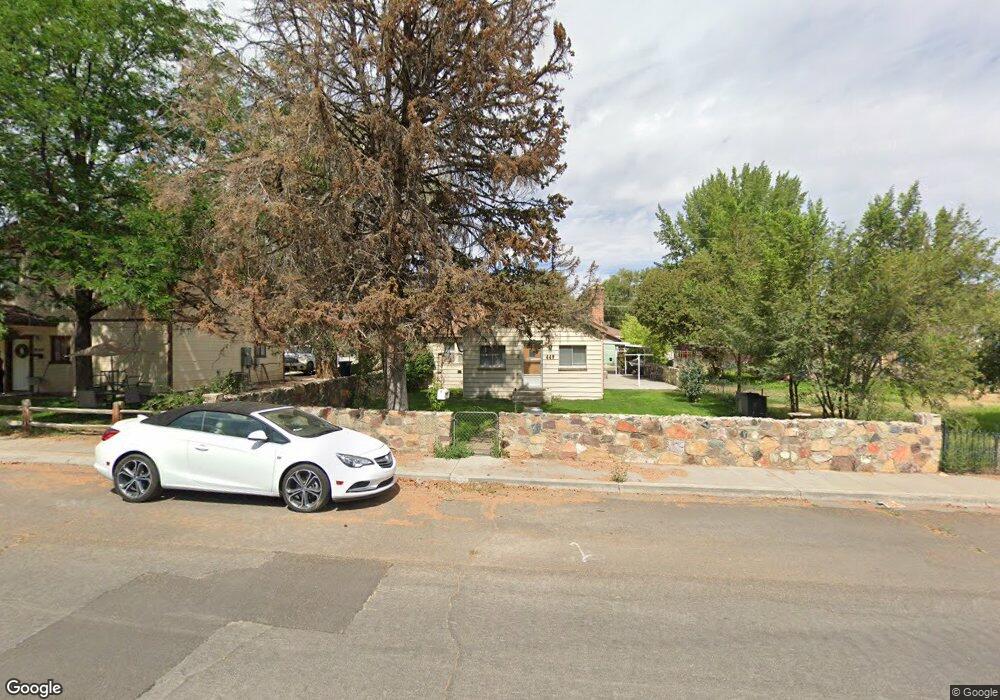
This home is located at 449 Maple St, Elko, NV 89801 and is currently estimated at $292,244, approximately $185 per square foot. 449 Maple St is a home located in Elko County with nearby schools including Northside Elementary School, Flagview Intermediate School, and Adobe Middle School.
Ownership History
Date
Name
Owned For
Owner Type
Purchase Details
Closed on
Feb 11, 2019
Sold by
Nelson Jay
Bought by
Nelson Catherine Y
Current Estimated Value
Home Financials for this Owner
Home Financials are based on the most recent Mortgage that was taken out on this home.
Original Mortgage
$156,600
Outstanding Balance
$137,679
Interest Rate
4.5%
Mortgage Type
New Conventional
Estimated Equity
$154,565
Purchase Details
Closed on
Feb 8, 2019
Sold by
Wines Holland P and Nelson Catherine Y
Bought by
Rose Joseph S
Home Financials for this Owner
Home Financials are based on the most recent Mortgage that was taken out on this home.
Original Mortgage
$156,600
Outstanding Balance
$137,679
Interest Rate
4.5%
Mortgage Type
New Conventional
Estimated Equity
$154,565
Purchase Details
Closed on
Feb 8, 2018
Sold by
Dussen Thadd L Vander and Dussen Ethel Vander
Bought by
Dussen Thadd L Vander
Purchase Details
Closed on
Jun 30, 2017
Sold by
Vander Dussen Thadd L
Bought by
Wines Holland P and Nelson Catherine Y
Create a Home Valuation Report for This Property
The Home Valuation Report is an in-depth analysis detailing your home's value as well as a comparison with similar homes in the area
Purchase History
| Date | Buyer | Sale Price | Title Company |
|---|---|---|---|
| Nelson Catherine Y | -- | Stewart Title Co | |
| Wines Holland P | -- | Stewart Title Co | |
| Rose Joseph S | $174,000 | Stewart Title Co | |
| Wines Holland P | -- | Stewart Title Co | |
| Dussen Thadd L Vander | -- | None Available | |
| Wines Holland P | -- | None Available |
Source: Public Records
Mortgage History
| Date | Status | Borrower | Loan Amount |
|---|---|---|---|
| Open | Rose Joseph S | $156,600 |
Source: Public Records
Tax History
| Year | Tax Paid | Tax Assessment Tax Assessment Total Assessment is a certain percentage of the fair market value that is determined by local assessors to be the total taxable value of land and additions on the property. | Land | Improvement |
|---|---|---|---|---|
| 2025 | $965 | $38,694 | $15,050 | $23,644 |
| 2024 | $965 | $30,126 | $6,615 | $23,511 |
| 2023 | $878 | $28,081 | $6,615 | $21,466 |
| 2022 | $853 | $24,544 | $6,615 | $17,929 |
| 2021 | $828 | $23,661 | $6,615 | $17,046 |
| 2020 | $803 | $23,454 | $6,615 | $16,839 |
| 2019 | $780 | $22,360 | $6,615 | $15,745 |
| 2018 | $770 | $22,091 | $6,615 | $15,476 |
| 2017 | $752 | $21,573 | $6,615 | $14,958 |
| 2016 | $734 | $21,033 | $6,615 | $14,418 |
| 2015 | $668 | $20,579 | $6,615 | $13,964 |
| 2014 | $648 | $19,700 | $6,615 | $13,085 |
Source: Public Records
Map
Nearby Homes
- 515 Ash St Unit 1
- 519 Ash St Unit 7
- 523 Ash St Unit 2
- 527 Ash St Unit 8
- 531 Ash St Unit 3
- 535 Ash St Unit 9
- 539 Ash St Unit 4
- 543 Ash St Unit 10
- 547 Ash St Unit 5
- 551 Ash St Unit 11
- 555 Ash St Unit 6
- 559 Ash St Unit 12
- 390 Ash St
- 452 Walnut St
- 072006013 Walnut St
- Country Rd Unit Mountain Meadows Ran
- 0 2nd St
- 145 Cedar St
- 0 3rd St
- 353 New Pine St
Your Personal Tour Guide
Ask me questions while you tour the home.