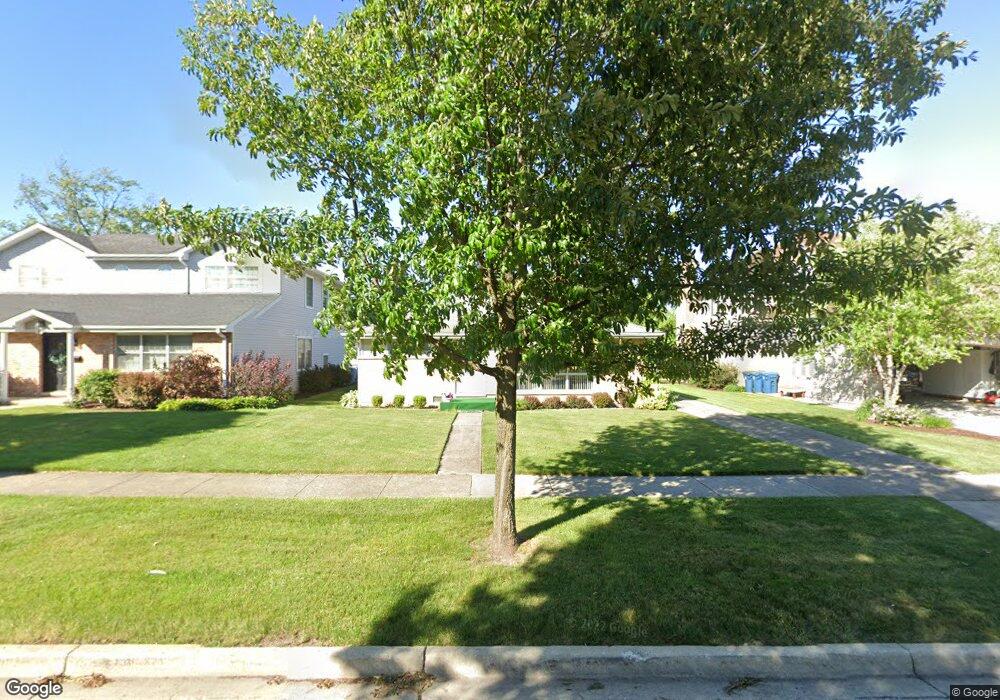
449 N Emery Ln Elmhurst, IL 60126
Estimated Value: $436,187 - $666,000
Studio
--
Bath
1,007
Sq Ft
$505/Sq Ft
Est. Value
About This Home
This home is located at 449 N Emery Ln, Elmhurst, IL 60126 and is currently estimated at $508,797, approximately $505 per square foot. 449 N Emery Ln is a home located in DuPage County with nearby schools including Emerson Elementary School, Churchville Middle School, and York Community High School.
Create a Home Valuation Report for This Property
The Home Valuation Report is an in-depth analysis detailing your home's value as well as a comparison with similar homes in the area
Home Values in the Area
Average Home Value in this Area
Tax History
| Year | Tax Paid | Tax Assessment Tax Assessment Total Assessment is a certain percentage of the fair market value that is determined by local assessors to be the total taxable value of land and additions on the property. | Land | Improvement |
|---|---|---|---|---|
| 2024 | $6,306 | $118,973 | $70,816 | $48,157 |
| 2023 | $5,763 | $109,370 | $65,100 | $44,270 |
| 2022 | $5,728 | $104,510 | $62,300 | $42,210 |
| 2021 | $5,465 | $100,100 | $59,670 | $40,430 |
| 2020 | $5,124 | $95,880 | $57,150 | $38,730 |
| 2019 | $5,055 | $92,190 | $54,950 | $37,240 |
| 2018 | $4,708 | $86,170 | $52,340 | $33,830 |
| 2017 | $4,595 | $82,350 | $50,020 | $32,330 |
| 2016 | $4,365 | $76,030 | $46,180 | $29,850 |
| 2015 | $4,239 | $70,230 | $42,660 | $27,570 |
| 2014 | $3,655 | $57,950 | $35,200 | $22,750 |
| 2013 | $3,652 | $59,130 | $35,920 | $23,210 |
Source: Public Records
Map
Nearby Homes
- 413 N Ridgeland Ave
- 468 N Highland Ave
- 374 N Myrtle Ave
- 370 N Oak St
- 367 N Oak St
- 432 N Ridgeland Ave
- 365 N Walnut St
- 270 W Fremont Ave
- 456 N Elm Ave
- 557 N Myrtle Ave
- 322 N Highland Ave
- 461 W Grantley Ave
- 526 N West Ave
- 528 West Ave
- 275 W North Ave
- 558 N Oaklawn Ave
- 538 N West Ave
- 284 N Highland Ave
- 483 N Larch Ave Unit 204W
- 332 N West Ave
Your Personal Tour Guide
Ask me questions while you tour the home.