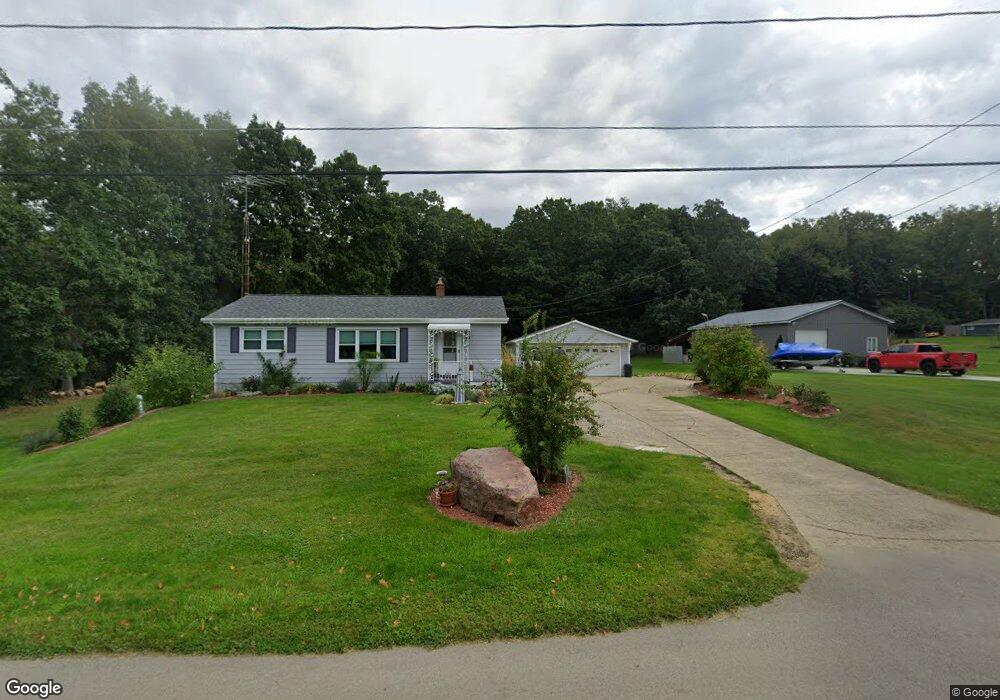
449 Pershing Ave Jackson, MI 49203
Estimated Value: $123,000 - $198,000
Studio
--
Bath
1,400
Sq Ft
$123/Sq Ft
Est. Value
About This Home
This home is located at 449 Pershing Ave, Jackson, MI 49203 and is currently estimated at $171,748, approximately $122 per square foot. 449 Pershing Ave is a home located in Jackson County with nearby schools including Western High School, Paragon Charter Academy, and Da Vinci Institute High School.
Ownership History
Date
Name
Owned For
Owner Type
Purchase Details
Closed on
Oct 26, 2021
Sold by
Cosgrove Paul A and Cosgrove Paul Allen
Bought by
Cosgrove Paul A and Cosgrove Annette A
Current Estimated Value
Home Financials for this Owner
Home Financials are based on the most recent Mortgage that was taken out on this home.
Original Mortgage
$108,000
Outstanding Balance
$98,699
Interest Rate
2.8%
Mortgage Type
New Conventional
Estimated Equity
$73,049
Purchase Details
Closed on
Apr 13, 2015
Sold by
Cosgrove William J and Vanderbor Michael E
Bought by
Cosgrove Paul Allen
Home Financials for this Owner
Home Financials are based on the most recent Mortgage that was taken out on this home.
Original Mortgage
$55,700
Interest Rate
3.77%
Mortgage Type
New Conventional
Purchase Details
Closed on
Feb 4, 2015
Sold by
Perrin Danyele C and Cosgrove Danyele C
Bought by
Cosgrove William J
Create a Home Valuation Report for This Property
The Home Valuation Report is an in-depth analysis detailing your home's value as well as a comparison with similar homes in the area
Home Values in the Area
Average Home Value in this Area
Purchase History
| Date | Buyer | Sale Price | Title Company |
|---|---|---|---|
| Cosgrove Paul A | -- | None Available | |
| Cosgrove Paul Allen | $55,000 | At | |
| Cosgrove William J | -- | None Available |
Source: Public Records
Mortgage History
| Date | Status | Borrower | Loan Amount |
|---|---|---|---|
| Open | Cosgrove Paul A | $108,000 | |
| Closed | Cosgrove Paul Allen | $55,700 |
Source: Public Records
Tax History
| Year | Tax Paid | Tax Assessment Tax Assessment Total Assessment is a certain percentage of the fair market value that is determined by local assessors to be the total taxable value of land and additions on the property. | Land | Improvement |
|---|---|---|---|---|
| 2025 | $1,868 | $71,550 | $0 | $0 |
| 2024 | $12 | $67,700 | $0 | $0 |
| 2023 | $874 | $50,800 | $0 | $0 |
| 2022 | $1,349 | $47,600 | $0 | $0 |
| 2021 | $1,324 | $40,000 | $0 | $0 |
| 2020 | $1,307 | $38,700 | $0 | $0 |
| 2019 | $1,272 | $38,100 | $0 | $0 |
| 2018 | $1,161 | $37,200 | $0 | $0 |
| 2017 | $1,099 | $38,400 | $0 | $0 |
| 2016 | $742 | $37,773 | $37,773 | $0 |
| 2015 | $1,054 | $31,647 | $31,647 | $0 |
| 2014 | $1,054 | $30,511 | $30,511 | $0 |
| 2013 | -- | $30,511 | $30,511 | $0 |
Source: Public Records
Map
Nearby Homes
- 3844 Westchester Blvd
- 0 Evelyn St
- 242 Kenneth St
- 2924 Sheridan Cirlce Unit 57
- 4009 Magnolia Pkwy
- 4116 Mulberry Cir Unit 31
- 3250 Carlton Blvd
- 745 W Barrington Cir Unit 92
- 778 W Barrington Cir Unit 75
- 693 Leo Rd
- 4070 Magnolia Pkwy
- 783 W Barrington Cir Unit 45
- 0 Laurence Ave Unit 25062864
- 0 Cummings Rd
- 4650 Suffolk Ln Unit 31
- 800 Obrien Rd
- 534 Barrett Ave
- VL Laurence Ave
- 0 VL Laurence Ave
- 4835 Staten Dr
- 441 Pershing Ave
- 438 Pershing Ave
- 527 Pershing Ave
- 522 Pershing Ave
- 522 Pershing Ave
- 429 Pershing Ave
- 432 Pershing Ave
- 356 Pershing Ave
- 544 Pershing Ave
- 415 Pershing Ave
- 548 Pershing Ave
- 551 Pershing Ave
- 347 Pershing Ave
- 348 Pershing Ave
- 401 Woodland Ave
- 549 Pershing Ave
- 393 Woodland Ave
- 425 Woodland Ave
- 345 Pershing Ave
- 411 Woodland Ave
Your Personal Tour Guide
Ask me questions while you tour the home.