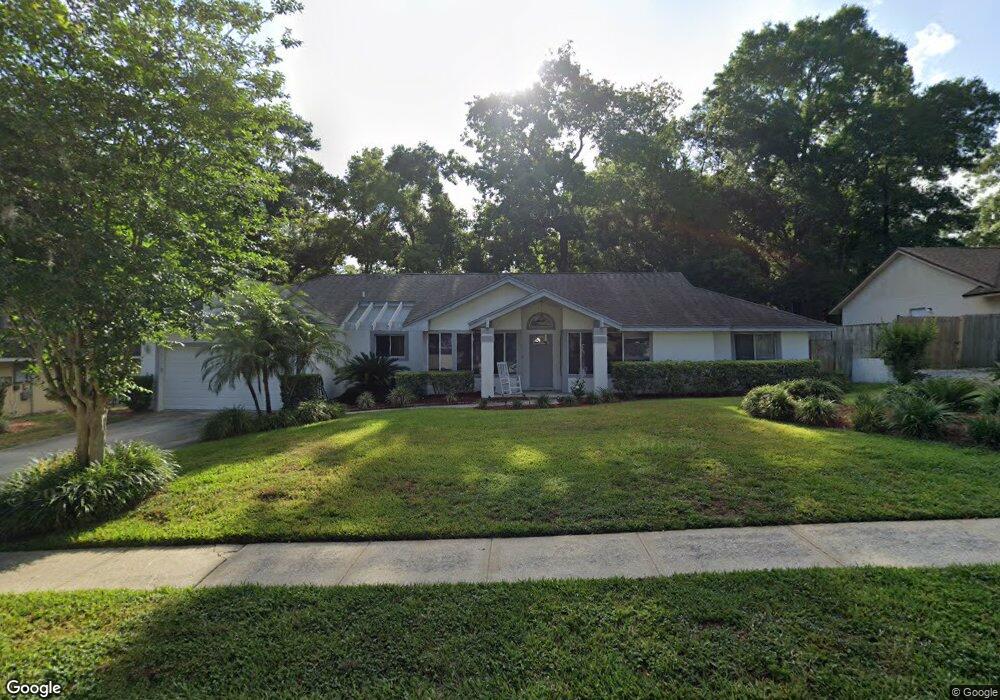
449 Via Florence Dr Apopka, FL 32712
Estimated Value: $351,222 - $371,000
3
Beds
2
Baths
2,289
Sq Ft
$159/Sq Ft
Est. Value
About This Home
This home is located at 449 Via Florence Dr, Apopka, FL 32712 and is currently estimated at $363,056, approximately $158 per square foot. 449 Via Florence Dr is a home located in Orange County with nearby schools including Clay Springs Elementary School, Apopka Middle School, and Apopka High School.
Ownership History
Date
Name
Owned For
Owner Type
Purchase Details
Closed on
Feb 17, 2017
Sold by
Halecky Robert
Bought by
Bowers Kelly Ann and Bowers Sean Howland
Current Estimated Value
Home Financials for this Owner
Home Financials are based on the most recent Mortgage that was taken out on this home.
Original Mortgage
$199,912
Outstanding Balance
$163,393
Interest Rate
3.75%
Mortgage Type
FHA
Estimated Equity
$199,663
Purchase Details
Closed on
Mar 25, 2005
Sold by
Lynd Willie Mae
Bought by
Halecky Robert
Home Financials for this Owner
Home Financials are based on the most recent Mortgage that was taken out on this home.
Original Mortgage
$134,400
Interest Rate
5.79%
Mortgage Type
Fannie Mae Freddie Mac
Purchase Details
Closed on
Feb 26, 1997
Sold by
Dorothy Rhode Tr and Leroy E Rhode Tr
Bought by
Lynd Medford D and Lynd Willie M
Home Financials for this Owner
Home Financials are based on the most recent Mortgage that was taken out on this home.
Original Mortgage
$60,000
Interest Rate
7.91%
Mortgage Type
New Conventional
Create a Home Valuation Report for This Property
The Home Valuation Report is an in-depth analysis detailing your home's value as well as a comparison with similar homes in the area
Home Values in the Area
Average Home Value in this Area
Purchase History
| Date | Buyer | Sale Price | Title Company |
|---|---|---|---|
| Bowers Kelly Ann | $203,600 | First International Title In | |
| Halecky Robert | $168,000 | K E L Title Ins Agency Inc | |
| Lynd Medford D | $107,000 | -- |
Source: Public Records
Mortgage History
| Date | Status | Borrower | Loan Amount |
|---|---|---|---|
| Open | Bowers Kelly Ann | $199,912 | |
| Previous Owner | Halecky Robert | $134,400 | |
| Previous Owner | Lynd Medford D | $60,000 | |
| Closed | Halecky Robert | $25,200 |
Source: Public Records
Tax History Compared to Growth
Tax History
| Year | Tax Paid | Tax Assessment Tax Assessment Total Assessment is a certain percentage of the fair market value that is determined by local assessors to be the total taxable value of land and additions on the property. | Land | Improvement |
|---|---|---|---|---|
| 2025 | $2,982 | $201,137 | -- | -- |
| 2024 | $2,789 | $201,137 | -- | -- |
| 2023 | $2,789 | $189,775 | $0 | $0 |
| 2022 | $2,667 | $184,248 | $0 | $0 |
| 2021 | $2,619 | $178,882 | $0 | $0 |
| 2020 | $2,491 | $176,412 | $0 | $0 |
| 2019 | $2,555 | $172,446 | $0 | $0 |
| 2018 | $2,518 | $169,231 | $33,000 | $136,231 |
| 2017 | $2,955 | $156,384 | $30,000 | $126,384 |
| 2016 | $2,928 | $152,755 | $30,000 | $122,755 |
| 2015 | $1,791 | $143,938 | $30,000 | $113,938 |
| 2014 | $1,828 | $124,009 | $30,000 | $94,009 |
Source: Public Records
Map
Nearby Homes
- 405 April Ln
- 445 Songbird Way
- 524 Ellie Ct
- 530 Ellie Ct
- 424 Dominish Estates Dr
- 464 Dominish Estates Dr
- 453 Dominish Estates Dr
- 1214 Votaw Rd
- 390 Lake McCoy Dr
- 111 N Cervidae Dr
- 1022 Love Ln Unit 35
- 575 Lake McCoy Dr
- 1011 Love Ln Unit 31
- 1005 Love Ln Unit 25
- 333 Bay St
- 309 Bay St
- 320 Avalone Dr
- CALI Plan at Sagewood
- Hayden Plan at Sagewood
- Elle Plan at Sagewood
- 461 Via Florence Dr
- 437 Via Florence Dr
- 831 Votaw Rd
- 448 Via Florence Dr
- 460 Via Florence Dr
- 436 Via Florence Dr
- 425 Via Florence Dr
- 504 Via Florence Dr
- 424 Via Florence Dr
- 429 April Ln
- 423 April Ln
- 413 Via Florence Dr
- 435 April Ln
- 516 Via Florence Dr
- 417 April Ln
- 412 Via Florence Dr
- 829 Votaw Rd
- 441 April Ln
- 527 Via Florence Dr
- 411 April Ln