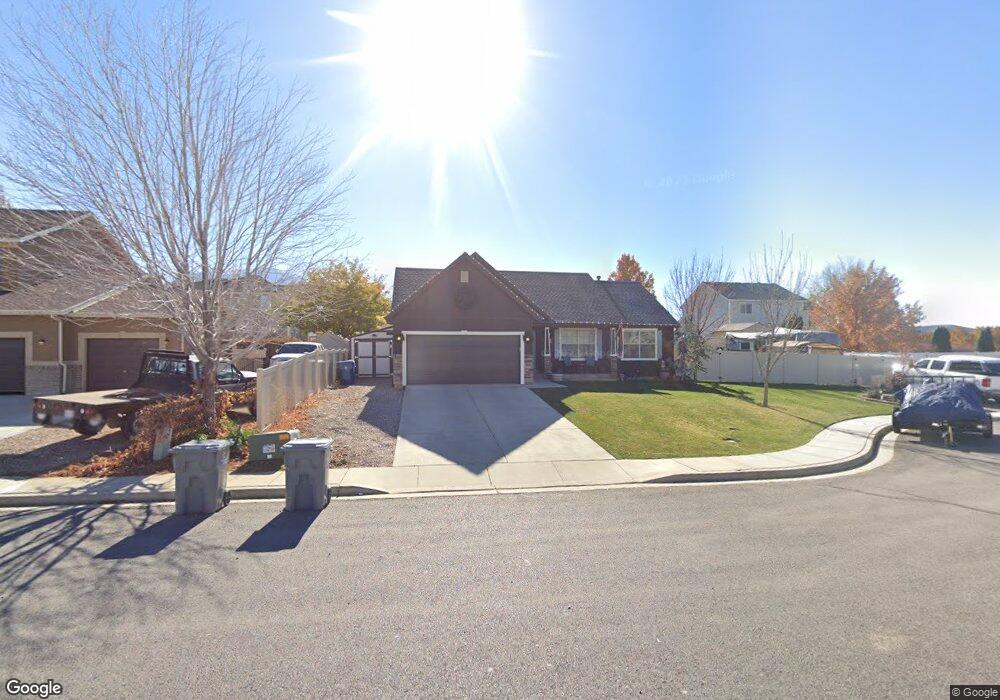
449 W 760 N Santaquin, UT 84655
Estimated Value: $515,000 - $554,000
5
Beds
3
Baths
2,882
Sq Ft
$187/Sq Ft
Est. Value
About This Home
This home is located at 449 W 760 N, Santaquin, UT 84655 and is currently estimated at $540,244, approximately $187 per square foot. 449 W 760 N is a home located in Utah County with nearby schools including Apple Valley Elementary, Payson Junior High School, and Payson High School.
Ownership History
Date
Name
Owned For
Owner Type
Purchase Details
Closed on
Sep 27, 2024
Sold by
Novak Kale and Novak Haylee
Bought by
Rugg Zachary and Rugg Yulia
Current Estimated Value
Home Financials for this Owner
Home Financials are based on the most recent Mortgage that was taken out on this home.
Original Mortgage
$537,092
Outstanding Balance
$531,594
Interest Rate
6.49%
Mortgage Type
FHA
Estimated Equity
$8,650
Purchase Details
Closed on
Jul 23, 2019
Sold by
Burningham Andrew and Burningham Amanda
Bought by
Novak Kale and Novak Haylee
Home Financials for this Owner
Home Financials are based on the most recent Mortgage that was taken out on this home.
Original Mortgage
$294,057
Interest Rate
3.75%
Mortgage Type
FHA
Purchase Details
Closed on
May 23, 2017
Sold by
Burningham Andrew
Bought by
Burningham Andrew and Burningham Amanda
Home Financials for this Owner
Home Financials are based on the most recent Mortgage that was taken out on this home.
Original Mortgage
$207,600
Interest Rate
4.08%
Mortgage Type
New Conventional
Purchase Details
Closed on
Nov 19, 2010
Sold by
Burningham Andrew
Bought by
Burningham Andrew and Burningham Amanda
Home Financials for this Owner
Home Financials are based on the most recent Mortgage that was taken out on this home.
Original Mortgage
$169,120
Interest Rate
4.25%
Mortgage Type
FHA
Purchase Details
Closed on
Jun 5, 2009
Sold by
Homes By Harmony Inc
Bought by
Burningham Andrew
Home Financials for this Owner
Home Financials are based on the most recent Mortgage that was taken out on this home.
Original Mortgage
$169,469
Interest Rate
4.78%
Mortgage Type
FHA
Purchase Details
Closed on
Jun 4, 2009
Sold by
Burningham Andrew
Bought by
Burningham Andrew and Burningham Amanda
Home Financials for this Owner
Home Financials are based on the most recent Mortgage that was taken out on this home.
Original Mortgage
$169,469
Interest Rate
4.78%
Mortgage Type
FHA
Purchase Details
Closed on
Dec 23, 2008
Sold by
Richmond American Homes Of Utah Inc
Bought by
Salisbury Development Lc
Create a Home Valuation Report for This Property
The Home Valuation Report is an in-depth analysis detailing your home's value as well as a comparison with similar homes in the area
Home Values in the Area
Average Home Value in this Area
Purchase History
| Date | Buyer | Sale Price | Title Company |
|---|---|---|---|
| Rugg Zachary | -- | Prospect Title | |
| Novak Kale | -- | Truly Title Inc Utah | |
| Burningham Andrew | -- | Pro Title & Escrow Inc | |
| Burningham Andrew | -- | Pro Title & Escrow Inc | |
| Burningham Andrew | -- | Provo Land Title Company | |
| Burningham Andrew | -- | Provo Land Title Company | |
| Burningham Andrew | -- | Provo Land Title Company | |
| Burningham Andrew | -- | Provo Land Title Company | |
| Salisbury Development Lc | -- | Equity Title Union Park |
Source: Public Records
Mortgage History
| Date | Status | Borrower | Loan Amount |
|---|---|---|---|
| Open | Rugg Zachary | $537,092 | |
| Previous Owner | Novak Kale | $294,057 | |
| Previous Owner | Burningham Andrew | $207,600 | |
| Previous Owner | Burningham Andrew | $169,120 | |
| Previous Owner | Burningham Andrew | $169,469 |
Source: Public Records
Tax History Compared to Growth
Tax History
| Year | Tax Paid | Tax Assessment Tax Assessment Total Assessment is a certain percentage of the fair market value that is determined by local assessors to be the total taxable value of land and additions on the property. | Land | Improvement |
|---|---|---|---|---|
| 2025 | $2,350 | $267,135 | $140,300 | $345,400 |
| 2024 | $2,448 | $233,970 | $0 | $0 |
| 2023 | $2,448 | $244,530 | $0 | $0 |
| 2022 | $2,748 | $283,195 | $0 | $0 |
| 2021 | $2,028 | $324,000 | $79,100 | $244,900 |
| 2020 | $1,951 | $302,000 | $68,800 | $233,200 |
| 2019 | $1,763 | $279,000 | $68,800 | $210,200 |
| 2018 | $1,657 | $250,100 | $60,100 | $190,000 |
| 2017 | $1,580 | $127,435 | $0 | $0 |
| 2016 | $1,497 | $118,305 | $0 | $0 |
| 2015 | $1,411 | $109,340 | $0 | $0 |
| 2014 | $1,348 | $104,280 | $0 | $0 |
Source: Public Records
Map
Nearby Homes
- 358 W 910 N
- 931 N 215 W
- 951 N 215 W
- 949 N 215 W
- 947 N 215 W
- 953 N 215 W
- 162 W 690 N
- McIntosh Plan at The Orchards
- Honey Plan at The Orchards
- Cranford Plan at The Orchards
- Monroe Plan at The Orchards
- Benson Plan at The Orchards
- Gala Plan at The Orchards
- 109 W 930 N
- 894 N Apple Seed Ln
- 369 N 500 W Unit 3
- 41 W 770 N
- 1032 N Apple Seed Ln
- 600 N Center St
- 931 N 160 E Unit 11