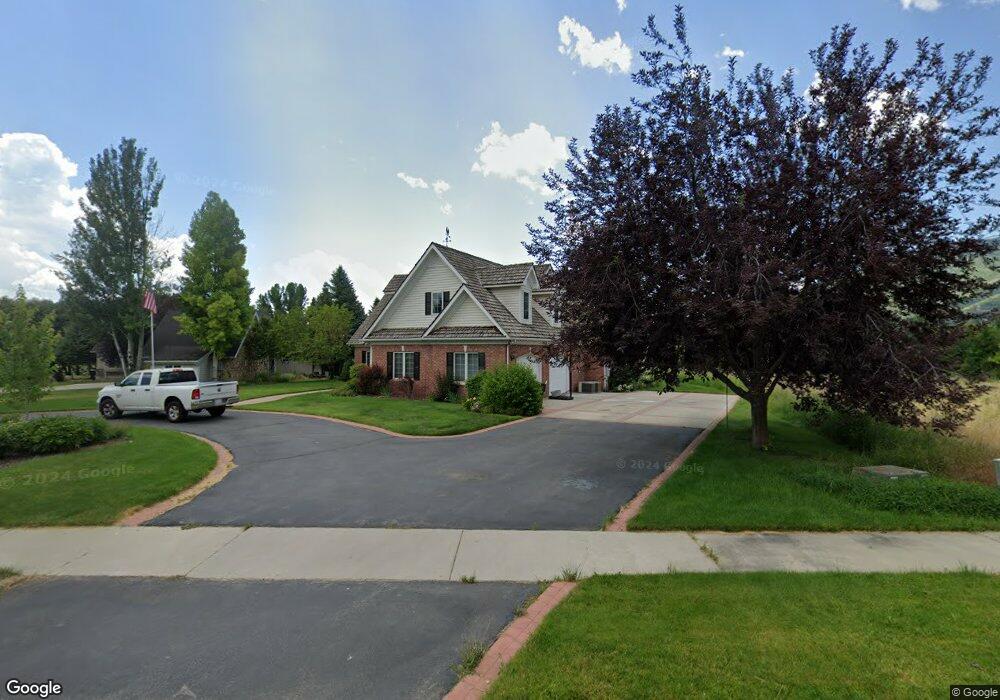
449 W Meadow Creek Ln Midway, UT 84049
Estimated Value: $1,363,000 - $1,788,000
4
Beds
4
Baths
4,578
Sq Ft
$338/Sq Ft
Est. Value
About This Home
This home is located at 449 W Meadow Creek Ln, Midway, UT 84049 and is currently estimated at $1,547,205, approximately $337 per square foot. 449 W Meadow Creek Ln is a home located in Wasatch County with nearby schools including Midway Elementary School, Rocky Mountain Middle School, and Wasatch High School.
Ownership History
Date
Name
Owned For
Owner Type
Purchase Details
Closed on
Jun 12, 2007
Sold by
Lloyd Gary M and Lloyd Donna W
Bought by
Clegg Morris G and Clegg Patricia B
Current Estimated Value
Home Financials for this Owner
Home Financials are based on the most recent Mortgage that was taken out on this home.
Original Mortgage
$612,000
Outstanding Balance
$373,871
Interest Rate
6.16%
Mortgage Type
New Conventional
Estimated Equity
$1,173,334
Purchase Details
Closed on
Feb 9, 2005
Sold by
Lloyd Gary M
Bought by
Huber Don A and Huber Arlene N
Purchase Details
Closed on
Feb 7, 2005
Sold by
Beck Linda M
Bought by
Lloyd Gary M
Purchase Details
Closed on
Feb 6, 2005
Sold by
Lloyd Gary M and Lloyd Donna W
Bought by
Lloyd Gary M
Purchase Details
Closed on
Feb 4, 2005
Sold by
Olson David H and Olson Ruby R
Bought by
Lloyd Gary M
Purchase Details
Closed on
Feb 3, 2005
Sold by
Bunker William B and Bunker Ann C
Bought by
Lloyd Gary M
Create a Home Valuation Report for This Property
The Home Valuation Report is an in-depth analysis detailing your home's value as well as a comparison with similar homes in the area
Home Values in the Area
Average Home Value in this Area
Purchase History
| Date | Buyer | Sale Price | Title Company |
|---|---|---|---|
| Clegg Morris G | -- | Atlas Title Insurance | |
| Huber Don A | -- | Atlas Title Insurance | |
| Lloyd Gary M | -- | Atlas Title Insurance | |
| Lloyd Gary M | -- | Atlas Title Insurance | |
| Lloyd Gary M | -- | Atlas Title Insurance | |
| Lloyd Gary M | -- | Atlas Title Insurance |
Source: Public Records
Mortgage History
| Date | Status | Borrower | Loan Amount |
|---|---|---|---|
| Open | Clegg Morris G | $612,000 |
Source: Public Records
Tax History Compared to Growth
Tax History
| Year | Tax Paid | Tax Assessment Tax Assessment Total Assessment is a certain percentage of the fair market value that is determined by local assessors to be the total taxable value of land and additions on the property. | Land | Improvement |
|---|---|---|---|---|
| 2025 | $5,867 | $1,157,500 | $300,000 | $857,500 |
| 2024 | $5,801 | $1,157,500 | $300,000 | $857,500 |
| 2023 | $5,801 | $950,000 | $200,000 | $750,000 |
| 2022 | $7,586 | $1,375,625 | $200,000 | $1,175,625 |
| 2021 | $3,858 | $540,686 | $95,000 | $445,686 |
| 2020 | $3,979 | $540,686 | $95,000 | $445,686 |
| 2019 | $3,640 | $297,377 | $0 | $0 |
| 2018 | $3,640 | $297,377 | $0 | $0 |
| 2017 | $3,438 | $279,220 | $0 | $0 |
| 2016 | $3,525 | $279,220 | $0 | $0 |
| 2015 | $3,349 | $279,220 | $0 | $0 |
| 2014 | $3,485 | $279,220 | $0 | $0 |
Source: Public Records
Map
Nearby Homes
- 325 W Burgi Ln
- 363 W 1150 N
- 1127 N 520 W Unit 40
- 1126 Springer View Loop
- 1128 N Springer View Loop
- 933 N Swiss Farm Ct
- 836 N Pinehurst Dr
- 1097 Matterhorn Ct
- 285 W Burnts Field Rd
- 308 Pine Canyon Rd Unit 14-387
- 1146 N Cottage Way
- 798 N 800 W Unit 8
- 700 N Homestead Dr Unit Bldg 23 Unit 104
- 700 N Homestead Dr Unit Bldg 22 Unit 201
- 700 N Homestead Dr Unit Bldg 23 Unit 201
- 700 N Homestead Dr Unit Bldg 23 Unit 105
- 700 N Homestead Dr Unit 22-202
- 700 N Homestead Dr Unit Bldg 23 Unit 102
- 700 N Homestead Dr Unit 22-101
- 700 N Homestead Dr Unit 23-101
- 471 W Meadowcreek Ln
- 429 W Meadowcreek Ln
- 429 Meadowcreek Ln
- 1031 N Meadowcreek Way
- 440 Meadowcreek Ln
- 420 Meadowcreek Ln
- 420 Meadowcreek Ln Unit 13
- 472 W Meadow Creek Dr
- 501 W Meadow Creek Ln
- 455 W Meadow Creek Dr
- 650 W Meadow Creek Dr
- 455 W Meadow Creek Dr Unit Lot 8
- 650 W Meadow Creek Dr Unit Lot 12
- 580 W Meadow Creek Dr Unit Lot 13
- 1053 Meadowcreek Ln
- 1049 Meadowcreek Ct
- 805 Pine Canyon Rd
- 815 Pine Canyon Rd
- 472 W Meadowcreek Ln N
- 460 W Mountain View Dr