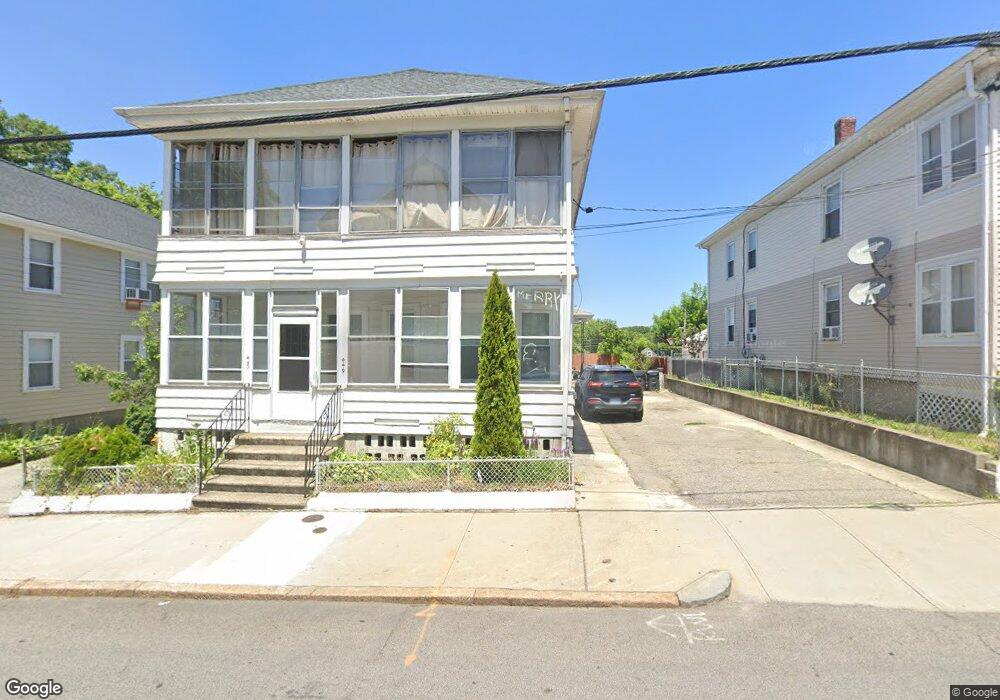
449 Weeden St Pawtucket, RI 02860
Estimated Value: $446,031 - $567,000
6
Beds
2
Baths
2,392
Sq Ft
$206/Sq Ft
Est. Value
About This Home
This home is located at 449 Weeden St, Pawtucket, RI 02860 and is currently estimated at $492,758, approximately $206 per square foot. 449 Weeden St is a home located in Providence County with nearby schools including Blackstone Valley Prep Upper Elementary School, Blackstone Valley Prep Junior High School, and Bishop Keough Regional High School.
Ownership History
Date
Name
Owned For
Owner Type
Purchase Details
Closed on
May 7, 2012
Sold by
Aacr Realty Llc
Bought by
Depina Francisco A
Current Estimated Value
Home Financials for this Owner
Home Financials are based on the most recent Mortgage that was taken out on this home.
Original Mortgage
$130,115
Outstanding Balance
$90,270
Interest Rate
4.08%
Mortgage Type
New Conventional
Estimated Equity
$402,488
Purchase Details
Closed on
Oct 4, 2011
Sold by
Department Of Housing & Urban Dev
Bought by
Costa Carlos and Rodrigues Carlos
Purchase Details
Closed on
Mar 22, 2011
Sold by
Phh Mortgage Corp
Bought by
Department Of Housing & Urban Dev
Purchase Details
Closed on
Mar 14, 2011
Sold by
Komlan-Adomey Anoumou
Bought by
Phh Mortgage Inc
Create a Home Valuation Report for This Property
The Home Valuation Report is an in-depth analysis detailing your home's value as well as a comparison with similar homes in the area
Home Values in the Area
Average Home Value in this Area
Purchase History
| Date | Buyer | Sale Price | Title Company |
|---|---|---|---|
| Depina Francisco A | $133,500 | -- | |
| Costa Carlos | -- | -- | |
| Department Of Housing & Urban Dev | -- | -- | |
| Phh Mortgage Inc | $236,763 | -- |
Source: Public Records
Mortgage History
| Date | Status | Borrower | Loan Amount |
|---|---|---|---|
| Open | Phh Mortgage Inc | $130,115 | |
| Previous Owner | Phh Mortgage Inc | $25,000 |
Source: Public Records
Tax History Compared to Growth
Tax History
| Year | Tax Paid | Tax Assessment Tax Assessment Total Assessment is a certain percentage of the fair market value that is determined by local assessors to be the total taxable value of land and additions on the property. | Land | Improvement |
|---|---|---|---|---|
| 2025 | $4,877 | $370,900 | $72,700 | $298,200 |
| 2024 | $4,577 | $370,900 | $72,700 | $298,200 |
| 2023 | $4,247 | $250,700 | $40,400 | $210,300 |
| 2022 | $4,157 | $250,700 | $40,400 | $210,300 |
| 2021 | $4,157 | $250,700 | $40,400 | $210,300 |
| 2020 | $4,026 | $192,700 | $53,800 | $138,900 |
| 2019 | $4,026 | $192,700 | $53,800 | $138,900 |
| 2018 | $3,879 | $192,700 | $53,800 | $138,900 |
| 2017 | $3,617 | $159,200 | $52,500 | $106,700 |
| 2016 | $3,485 | $159,200 | $52,500 | $106,700 |
| 2015 | $3,485 | $159,200 | $52,500 | $106,700 |
| 2014 | $3,457 | $149,900 | $52,500 | $97,400 |
Source: Public Records
Map
Nearby Homes
- 449 Weeden St
- 455 Weeden St
- 443 Weeden St
- 450 Weeden St
- 40 W Carpenter St
- 452 Weeden St
- 34 W Carpenter St
- 28 W Carpenter St
- 46 W Carpenter St
- 433 Weeden St
- 50 W Carpenter St
- 468 Weeden St
- 20 W Carpenter St
- 60 W Carpenter St
- 20 W Carpenter St
- 427 Weeden St
- 471 Weeden St
- 428 Weeden St
- 31 Derby St
- 25 Derby St