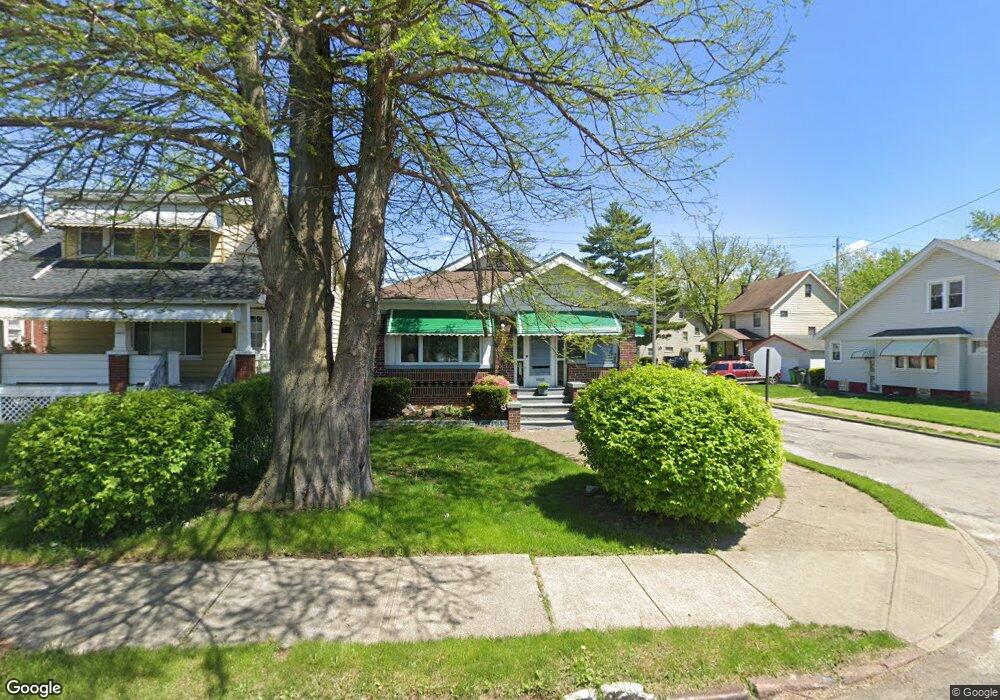
4491 E 139th St Garfield Heights, OH 44105
Estimated Value: $94,666 - $134,000
3
Beds
1
Bath
1,050
Sq Ft
$104/Sq Ft
Est. Value
About This Home
This home is located at 4491 E 139th St, Garfield Heights, OH 44105 and is currently estimated at $108,917, approximately $103 per square foot. 4491 E 139th St is a home located in Cuyahoga County with nearby schools including Andrew J. Rickoff School, Adlai Stevenson School, and Anton Grdina School.
Ownership History
Date
Name
Owned For
Owner Type
Purchase Details
Closed on
Jan 6, 2006
Sold by
Beyah Brenda F
Bought by
Parker Marjorie
Current Estimated Value
Home Financials for this Owner
Home Financials are based on the most recent Mortgage that was taken out on this home.
Original Mortgage
$17,800
Outstanding Balance
$10,094
Interest Rate
6.42%
Mortgage Type
Stand Alone Second
Estimated Equity
$98,823
Purchase Details
Closed on
Feb 1, 1996
Sold by
Lippert Michelle M
Bought by
Beyah Brenda F
Home Financials for this Owner
Home Financials are based on the most recent Mortgage that was taken out on this home.
Original Mortgage
$61,452
Interest Rate
7.24%
Mortgage Type
FHA
Purchase Details
Closed on
Oct 28, 1991
Sold by
Perry Erma L
Bought by
Perry Erma Lee
Purchase Details
Closed on
Jun 24, 1986
Sold by
Perry Eddie
Bought by
Perry Erma L
Purchase Details
Closed on
Jul 28, 1981
Sold by
Gorham Maggie
Bought by
Perry Eddie
Purchase Details
Closed on
Jan 1, 1975
Bought by
Gorham Maggie
Create a Home Valuation Report for This Property
The Home Valuation Report is an in-depth analysis detailing your home's value as well as a comparison with similar homes in the area
Home Values in the Area
Average Home Value in this Area
Purchase History
| Date | Buyer | Sale Price | Title Company |
|---|---|---|---|
| Parker Marjorie | $89,000 | Tower City Title Agency L | |
| Beyah Brenda F | $61,000 | -- | |
| Perry Erma Lee | -- | -- | |
| Perry Erma L | -- | -- | |
| Perry Eddie | -- | -- | |
| Gorham Maggie | -- | -- |
Source: Public Records
Mortgage History
| Date | Status | Borrower | Loan Amount |
|---|---|---|---|
| Open | Parker Marjorie | $17,800 | |
| Open | Parker Marjorie | $71,200 | |
| Previous Owner | Beyah Brenda F | $61,452 |
Source: Public Records
Tax History Compared to Growth
Tax History
| Year | Tax Paid | Tax Assessment Tax Assessment Total Assessment is a certain percentage of the fair market value that is determined by local assessors to be the total taxable value of land and additions on the property. | Land | Improvement |
|---|---|---|---|---|
| 2024 | $2,205 | $34,650 | $4,830 | $29,820 |
| 2023 | $1,035 | $18,800 | $2,630 | $16,170 |
| 2022 | $1,049 | $18,800 | $2,630 | $16,170 |
| 2021 | $1,048 | $18,800 | $2,630 | $16,170 |
| 2020 | $1,124 | $18,450 | $2,590 | $15,860 |
| 2019 | $1,059 | $52,700 | $7,400 | $45,300 |
| 2018 | $1,024 | $18,450 | $2,590 | $15,860 |
| 2017 | $1,012 | $17,890 | $2,730 | $15,160 |
| 2016 | $1,019 | $17,890 | $2,730 | $15,160 |
| 2015 | $1,510 | $17,890 | $2,730 | $15,160 |
| 2014 | $1,510 | $23,250 | $3,540 | $19,710 |
Source: Public Records
Map
Nearby Homes
- 13804 Rexwood Ave
- 13604 Maplerow Ave
- 4412 E 142nd St
- 4412 E 144th St
- 13625 Cranwood Dr
- 4436 E 146th St
- 13315 Thornhurst Ave
- 13624 North Dr
- 13212 Maplerow Ave
- 4384 E 144th St
- 13208 Maplerow Ave
- 4333 E 142nd St
- 4297 E 139th St
- 13531 Cranwood Park Blvd
- 13613 Beachwood Ave
- 12901 Maplerow Ave
- 15009 Lawndale Ave
- 4682 E 147th St
- 12716 Rexwood Ave
- 4286 E 133rd St
- 4487 E 139th St
- 4487 E 139th St Unit E
- 4483 E 139th St
- 4499 E 139th St
- 14001 Christine Ave
- 4479 E 139th St
- 14005 Christine Ave
- 4503 E 139th St
- 13821 Christine Ave
- 14000 Christine Ave
- 4475 E 139th St
- 14009 Christine Ave
- 14008 Christine Ave
- 13817 Christine Ave
- 4507 E 139th St
- 14002 Maplerow Ave
- 14013 Christine Ave
- 14006 Maplerow Ave
- 13813 Christine Ave
- 4511 E 139th St