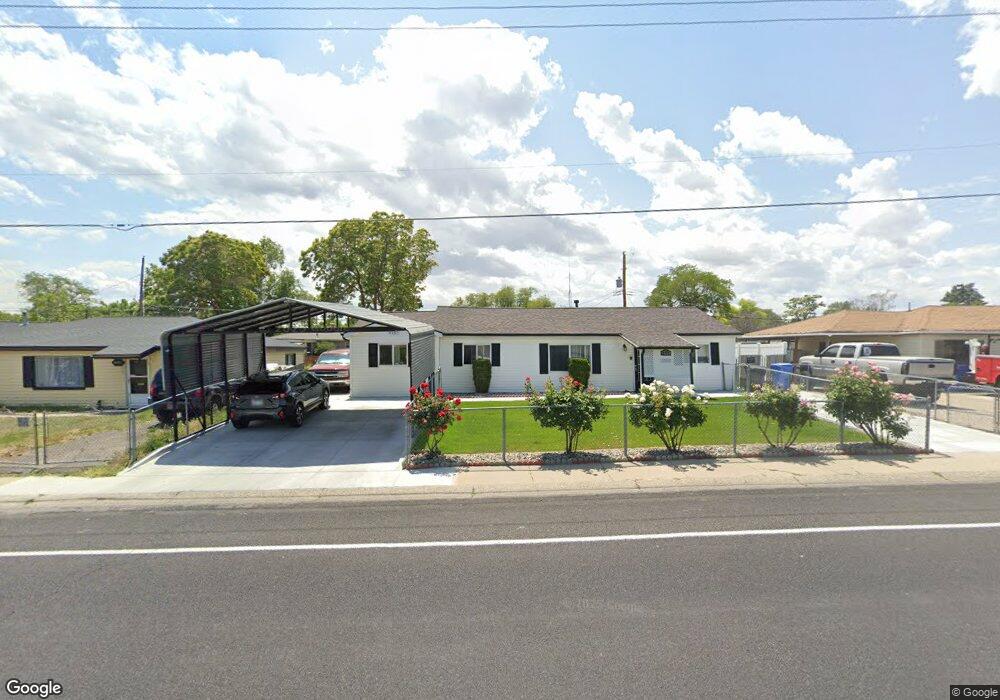
4491 W 4865 S Salt Lake City, UT 84118
Estimated Value: $384,000 - $406,000
3
Beds
2
Baths
1,440
Sq Ft
$274/Sq Ft
Est. Value
About This Home
This home is located at 4491 W 4865 S, Salt Lake City, UT 84118 and is currently estimated at $395,094, approximately $274 per square foot. 4491 W 4865 S is a home located in Salt Lake County with nearby schools including West Kearns Elementary School, Kearns Jr High School, and Kearns High School.
Ownership History
Date
Name
Owned For
Owner Type
Purchase Details
Closed on
Dec 29, 2000
Sold by
Shaw Daniel
Bought by
Mcbride George A and Mcbride Carol W
Current Estimated Value
Purchase Details
Closed on
Nov 17, 1999
Sold by
Mortensen Gordon Lee and Mortensen Gladys Sharon
Bought by
Godinez Javier and Godinez Silvia
Home Financials for this Owner
Home Financials are based on the most recent Mortgage that was taken out on this home.
Original Mortgage
$111,084
Interest Rate
7.82%
Mortgage Type
FHA
Purchase Details
Closed on
Sep 29, 1995
Sold by
Stevens Richard and Stevens Marilyn
Bought by
Mortensen Gordon Lee and Mortensen Gladys Sharon
Home Financials for this Owner
Home Financials are based on the most recent Mortgage that was taken out on this home.
Original Mortgage
$87,612
Interest Rate
7.97%
Mortgage Type
FHA
Create a Home Valuation Report for This Property
The Home Valuation Report is an in-depth analysis detailing your home's value as well as a comparison with similar homes in the area
Home Values in the Area
Average Home Value in this Area
Purchase History
| Date | Buyer | Sale Price | Title Company |
|---|---|---|---|
| Mcbride George A | -- | -- | |
| Godinez Javier | -- | Superior Title | |
| Mortensen Gordon Lee | -- | -- |
Source: Public Records
Mortgage History
| Date | Status | Borrower | Loan Amount |
|---|---|---|---|
| Previous Owner | Godinez Javier | $111,084 | |
| Previous Owner | Mortensen Gordon Lee | $87,612 |
Source: Public Records
Tax History Compared to Growth
Tax History
| Year | Tax Paid | Tax Assessment Tax Assessment Total Assessment is a certain percentage of the fair market value that is determined by local assessors to be the total taxable value of land and additions on the property. | Land | Improvement |
|---|---|---|---|---|
| 2025 | $2,328 | $332,800 | $83,700 | $249,100 |
| 2024 | $2,328 | $313,400 | $78,700 | $234,700 |
| 2023 | $2,158 | $279,000 | $75,600 | $203,400 |
| 2022 | $2,224 | $295,400 | $74,200 | $221,200 |
| 2021 | $2,022 | $243,100 | $57,100 | $186,000 |
| 2020 | $1,855 | $208,400 | $52,000 | $156,400 |
| 2019 | $1,843 | $204,900 | $49,000 | $155,900 |
| 2018 | $1,739 | $186,600 | $49,000 | $137,600 |
| 2017 | $1,429 | $160,500 | $49,000 | $111,500 |
| 2016 | $1,218 | $137,000 | $45,200 | $91,800 |
| 2015 | $1,078 | $112,900 | $58,000 | $54,900 |
| 2014 | $1,003 | $102,800 | $53,900 | $48,900 |
Source: Public Records
Map
Nearby Homes