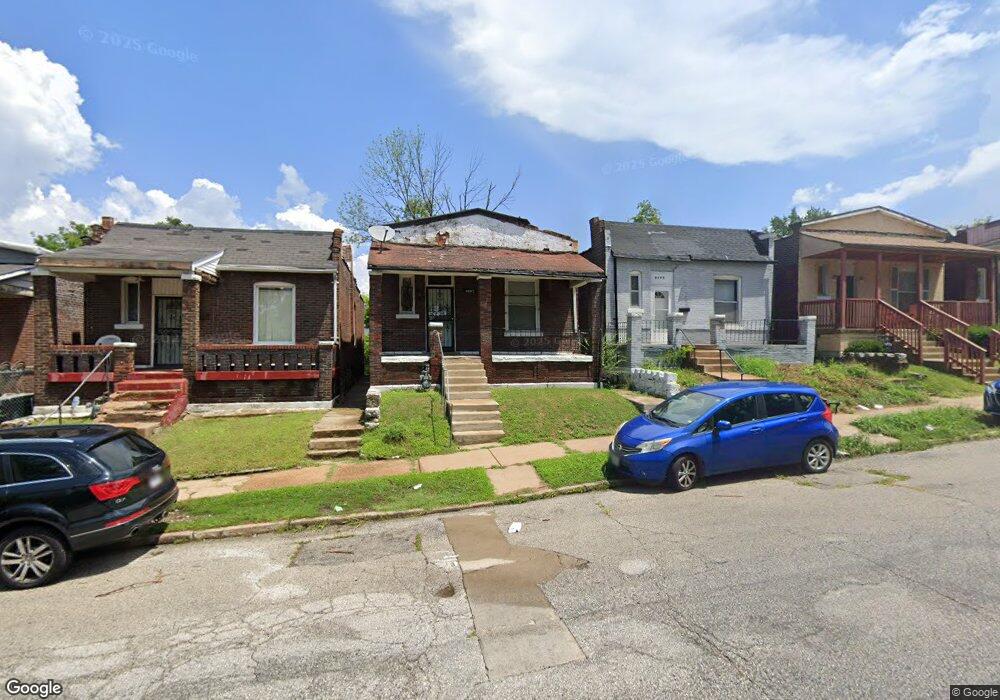
4493 Lee Ave Saint Louis, MO 63115
Penrose NeighborhoodEstimated Value: $41,000 - $64,000
Studio
1
Bath
2,024
Sq Ft
$24/Sq Ft
Est. Value
About This Home
This home is located at 4493 Lee Ave, Saint Louis, MO 63115 and is currently estimated at $49,033, approximately $24 per square foot. 4493 Lee Ave is a home located in St. Louis City with nearby schools including Ashland Elementary School, Yeatman-Liddell Middle School, and Vashon High School.
Ownership History
Date
Name
Owned For
Owner Type
Purchase Details
Closed on
Oct 27, 2023
Sold by
Phelps Michael
Bought by
Brick House Rental Property Llc-Series E/4493
Current Estimated Value
Purchase Details
Closed on
Jan 30, 2018
Sold by
Phelps Simone and Elkat Simone
Bought by
Phelps Michael F
Purchase Details
Closed on
May 22, 2002
Sold by
Phelps Michael F and Phelps Simone
Bought by
Phelps Michael F and Phelps Simone
Home Financials for this Owner
Home Financials are based on the most recent Mortgage that was taken out on this home.
Original Mortgage
$35,700
Interest Rate
7.9%
Mortgage Type
Purchase Money Mortgage
Purchase Details
Closed on
Mar 11, 2002
Sold by
Cutler Sylvia M
Bought by
Phelps Michael F
Purchase Details
Closed on
Mar 29, 1997
Sold by
Frances Henderson and Henderson Frances Henderson
Bought by
Otey Frances Henderson and Cutler Sylvia M
Create a Home Valuation Report for This Property
The Home Valuation Report is an in-depth analysis detailing your home's value as well as a comparison with similar homes in the area
Home Values in the Area
Average Home Value in this Area
Purchase History
| Date | Buyer | Sale Price | Title Company |
|---|---|---|---|
| Brick House Rental Property Llc-Series E/4493 | -- | None Listed On Document | |
| Phelps Michael F | -- | None Available | |
| Phelps Michael F | -- | -- | |
| Phelps Michael F | -- | -- | |
| Otey Frances Henderson | -- | -- |
Source: Public Records
Mortgage History
| Date | Status | Borrower | Loan Amount |
|---|---|---|---|
| Previous Owner | Phelps Michael F | $35,700 |
Source: Public Records
Tax History
| Year | Tax Paid | Tax Assessment Tax Assessment Total Assessment is a certain percentage of the fair market value that is determined by local assessors to be the total taxable value of land and additions on the property. | Land | Improvement |
|---|---|---|---|---|
| 2025 | $245 | $2,690 | $250 | $2,440 |
| 2024 | $234 | $2,590 | $250 | $2,340 |
| 2023 | $234 | $2,590 | $250 | $2,340 |
| 2022 | $239 | $2,550 | $250 | $2,300 |
| 2021 | $239 | $2,550 | $250 | $2,300 |
| 2020 | $237 | $2,550 | $250 | $2,300 |
| 2019 | $236 | $2,550 | $250 | $2,300 |
| 2018 | $244 | $2,570 | $250 | $2,320 |
| 2017 | $241 | $2,570 | $250 | $2,320 |
| 2016 | $295 | $3,190 | $490 | $2,700 |
| 2015 | $270 | $3,190 | $490 | $2,700 |
| 2014 | $329 | $3,190 | $490 | $2,700 |
| 2013 | -- | $3,970 | $490 | $3,480 |
Source: Public Records
Map
Nearby Homes
- 4464 Lee Ave
- 4556 Carter Ave
- 3003 TAYOR N Taylor Ave
- 4534 Margaretta Ave
- 4655 Farlin Ave
- 4709 Penrose St
- 4418 Dryden Ave
- 4627 Korte Ave
- 4006 Marcus Ave
- 4707 Farlin Ave
- 4482 San Francisco Ave
- 4538 San Francisco Ave
- 4739 Bessie Ct
- 4410 Marcus Ave
- 4724 Kossuth Ave
- 4729 Margaretta Ave
- 4215 Shreve Ave
- 4210 Holly Ave
- 4475 N Taylor Ave
- 4402 Clarence Ave
- 4491 Lee Ave
- 4495 Lee Ave
- 4489 Lee Ave
- 4497 Lee Ave
- 4499 Lee Ave Unit B
- 4499 Lee Ave Unit A
- 4487 Lee Ave
- 4485 Lee Ave
- 4490 Penrose St
- 4492 Penrose St
- 4486 Penrose St
- 4483 Lee Ave
- 4488 Penrose St
- 4494 Penrose St
- 4484 Penrose St
- 4482 Penrose St
- 4481 Lee Ave
- 4496 Penrose St
- 4139 Camellia Ave
- 4480 Penrose St
Your Personal Tour Guide
Ask me questions while you tour the home.