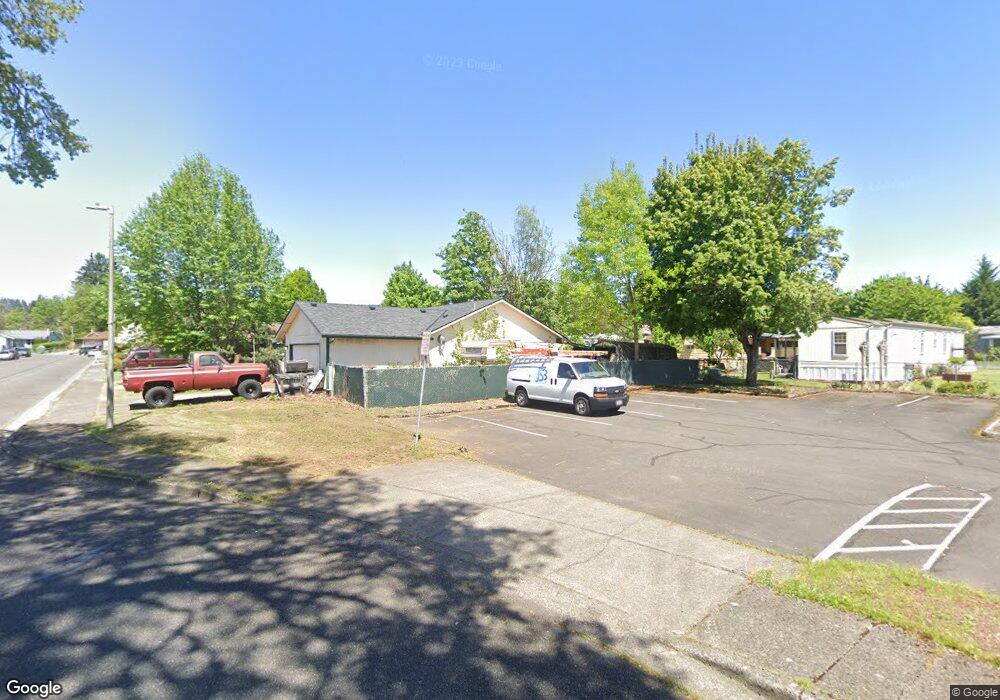
4494 Addy Loop Washougal, WA 98671
Estimated Value: $410,000 - $450,098
3
Beds
3
Baths
1,450
Sq Ft
$298/Sq Ft
Est. Value
About This Home
This home is located at 4494 Addy Loop, Washougal, WA 98671 and is currently estimated at $432,275, approximately $298 per square foot. 4494 Addy Loop is a home located in Clark County with nearby schools including Columbia River Gorge Elementary School, Jemtegaard Middle School, and Washougal High School.
Ownership History
Date
Name
Owned For
Owner Type
Purchase Details
Closed on
Jan 13, 2004
Sold by
Shoemaker Kathaleen M
Bought by
Logsdon Leslie S
Current Estimated Value
Home Financials for this Owner
Home Financials are based on the most recent Mortgage that was taken out on this home.
Original Mortgage
$131,138
Outstanding Balance
$61,838
Interest Rate
6.02%
Mortgage Type
FHA
Estimated Equity
$370,437
Create a Home Valuation Report for This Property
The Home Valuation Report is an in-depth analysis detailing your home's value as well as a comparison with similar homes in the area
Home Values in the Area
Average Home Value in this Area
Purchase History
| Date | Buyer | Sale Price | Title Company |
|---|---|---|---|
| Logsdon Leslie S | $154,732 | Stewart Title |
Source: Public Records
Mortgage History
| Date | Status | Borrower | Loan Amount |
|---|---|---|---|
| Open | Logsdon Leslie S | $131,138 |
Source: Public Records
Tax History Compared to Growth
Tax History
| Year | Tax Paid | Tax Assessment Tax Assessment Total Assessment is a certain percentage of the fair market value that is determined by local assessors to be the total taxable value of land and additions on the property. | Land | Improvement |
|---|---|---|---|---|
| 2025 | $3,698 | $340,334 | $116,000 | $224,334 |
| 2024 | $3,574 | $389,615 | $160,080 | $229,535 |
| 2023 | $3,416 | $393,977 | $160,080 | $233,897 |
| 2022 | $3,443 | $368,737 | $153,120 | $215,617 |
| 2021 | $3,271 | $322,596 | $134,560 | $188,036 |
| 2020 | $2,967 | $287,608 | $121,800 | $165,808 |
| 2019 | $2,756 | $265,015 | $116,000 | $149,015 |
| 2018 | $3,004 | $260,275 | $0 | $0 |
| 2017 | $2,512 | $234,198 | $0 | $0 |
| 2016 | $2,369 | $215,022 | $0 | $0 |
| 2015 | $2,193 | $185,465 | $0 | $0 |
| 2014 | -- | $170,826 | $0 | $0 |
| 2013 | -- | $150,976 | $0 | $0 |
Source: Public Records
Map
Nearby Homes