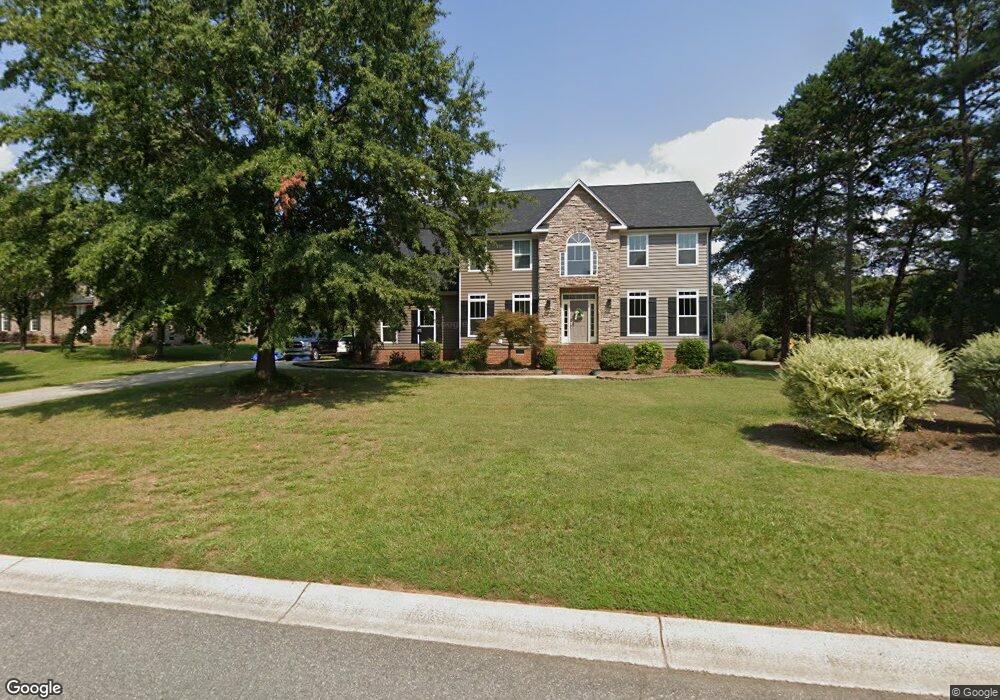
4494 Long Cove Dr Denver, NC 28037
Estimated Value: $726,271
4
Beds
3
Baths
3,314
Sq Ft
$219/Sq Ft
Est. Value
About This Home
This home is located at 4494 Long Cove Dr, Denver, NC 28037 and is currently estimated at $726,271, approximately $219 per square foot. 4494 Long Cove Dr is a home located in Lincoln County with nearby schools including Rock Springs Elementary School, North Lincoln Middle School, and North Lincoln High School.
Ownership History
Date
Name
Owned For
Owner Type
Purchase Details
Closed on
May 9, 2017
Sold by
Ward Shawn D and Ward Karla Cagle
Bought by
Ward Shawn D and Ward Karla Cagle
Current Estimated Value
Home Financials for this Owner
Home Financials are based on the most recent Mortgage that was taken out on this home.
Original Mortgage
$277,000
Outstanding Balance
$230,612
Interest Rate
4.14%
Mortgage Type
New Conventional
Estimated Equity
$495,659
Purchase Details
Closed on
Oct 5, 2007
Sold by
Shephard Clifford Freeman and Metz Shephard Hollie Lea
Bought by
Ward Shawn D
Home Financials for this Owner
Home Financials are based on the most recent Mortgage that was taken out on this home.
Original Mortgage
$316,000
Interest Rate
6.41%
Mortgage Type
New Conventional
Purchase Details
Closed on
Jul 17, 2000
Bought by
Shephard Clifford Freeman and Shephard Hollie
Purchase Details
Closed on
Apr 24, 1998
Bought by
Reese Andrew P and Corder Scott F
Create a Home Valuation Report for This Property
The Home Valuation Report is an in-depth analysis detailing your home's value as well as a comparison with similar homes in the area
Home Values in the Area
Average Home Value in this Area
Purchase History
| Date | Buyer | Sale Price | Title Company |
|---|---|---|---|
| Ward Shawn D | -- | None Available | |
| Ward Shawn D | $395,000 | None Available | |
| Shephard Clifford Freeman | $43,000 | -- | |
| Reese Andrew P | $37,000 | -- |
Source: Public Records
Mortgage History
| Date | Status | Borrower | Loan Amount |
|---|---|---|---|
| Open | Ward Shawn D | $277,000 | |
| Closed | Ward Shawn D | $316,000 |
Source: Public Records
Tax History Compared to Growth
Tax History
| Year | Tax Paid | Tax Assessment Tax Assessment Total Assessment is a certain percentage of the fair market value that is determined by local assessors to be the total taxable value of land and additions on the property. | Land | Improvement |
|---|---|---|---|---|
| 2025 | $3,535 | $561,103 | $68,000 | $493,103 |
| 2024 | $3,503 | $561,103 | $68,000 | $493,103 |
| 2023 | $3,625 | $582,133 | $68,000 | $514,133 |
| 2022 | $2,916 | $378,021 | $77,000 | $301,021 |
| 2021 | $2,890 | $378,021 | $77,000 | $301,021 |
| 2020 | $2,699 | $378,021 | $77,000 | $301,021 |
| 2019 | $2,699 | $378,021 | $77,000 | $301,021 |
| 2018 | $2,737 | $323,713 | $74,000 | $249,713 |
| 2017 | $2,350 | $323,713 | $74,000 | $249,713 |
| 2016 | $2,342 | $323,713 | $74,000 | $249,713 |
| 2015 | $2,553 | $323,713 | $74,000 | $249,713 |
| 2014 | $2,566 | $350,821 | $86,000 | $264,821 |
Source: Public Records
Map
Nearby Homes
- 4609 Firethorn Ct
- 44 Cottonwood Dr
- 7656 Juniper Ln Unit 15
- #19 Juniper Ln
- 30 Cottonwood Dr
- 00 Summit Ridge Ln
- 4511 Morning Dove Ct
- 4901 Burton Ln
- 4424 Augusta Ridge Ct
- 7717 Nautical View
- 4237 Little Fork Cove Rd
- 4018 Halyard Dr
- 4550 Osprey Run Ct
- 4548 Stonesthrow Dr
- 4017 Halyard Dr
- 00 Hawkes Bay Ct Unit 121
- 3981 Spinnaker Place
- 4028 Spindrift Cove Unit 60
- 0000 Spindrift Cove Unit 59
- 4013 Spindrift Cove Dr
- 4508 Long Cove Dr
- Lot 9 Long Cove Dr
- 4329 Crepe Ridge Dr
- 4507 Webbs Chapel Church Rd
- 4497 Long Cove Dr
- Lot #350 Crepe Ridge Dr Unit 350
- 4509 Long Cove Dr
- 4487 Long Cove Dr
- 4319 Crepe Ridge Dr
- 4319 Crepe Ridge Dr Unit 348
- 4514 Webbs Chapel Church Rd
- 4514 Webbs Chapel Church Rd
- 4311 Crepe Ridge Dr
- 4519 Long Cove Dr
- 4339 Crepe Ridge Dr
- Lot 12 Long Cove Dr
- Lot 12 Long Cove Dr Unit 12
- Lot #351 Crepe Ridge Dr Unit 351
- 351 Crepe Ridge Dr Unit 351
- Lot #346 Crepe Ridge Dr Unit 346