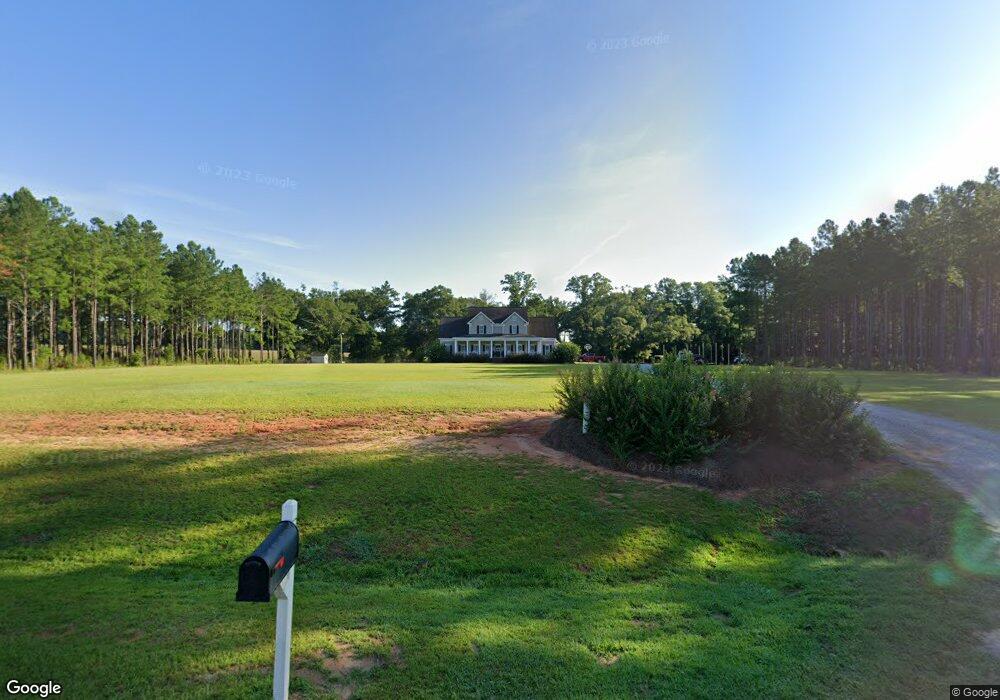
4495 Lower Shellman Rd Shellman, GA 39886
Estimated Value: $290,000 - $515,520
4
Beds
4
Baths
3,751
Sq Ft
$107/Sq Ft
Est. Value
About This Home
This home is located at 4495 Lower Shellman Rd, Shellman, GA 39886 and is currently estimated at $402,760, approximately $107 per square foot. 4495 Lower Shellman Rd is a home located in Randolph County with nearby schools including Randolph County Elementary School, Randolph Clay Middle School, and Randolph Clay High School.
Ownership History
Date
Name
Owned For
Owner Type
Purchase Details
Closed on
Mar 26, 2021
Sold by
Sauls Jason S
Bought by
Sauls Jason S and Sauls Hallah H
Current Estimated Value
Purchase Details
Closed on
Mar 30, 2004
Sold by
Sauls Billy and Sauls Frankie
Bought by
Sauls Jason S
Create a Home Valuation Report for This Property
The Home Valuation Report is an in-depth analysis detailing your home's value as well as a comparison with similar homes in the area
Home Values in the Area
Average Home Value in this Area
Purchase History
| Date | Buyer | Sale Price | Title Company |
|---|---|---|---|
| Sauls Jason S | -- | -- | |
| Sauls Jason S | -- | -- | |
| Sauls Jason S | -- | -- | |
| Sauls Jason S | -- | -- |
Source: Public Records
Tax History
| Year | Tax Paid | Tax Assessment Tax Assessment Total Assessment is a certain percentage of the fair market value that is determined by local assessors to be the total taxable value of land and additions on the property. | Land | Improvement |
|---|---|---|---|---|
| 2024 | $6,064 | $159,000 | $5,400 | $153,600 |
| 2023 | $4,981 | $152,240 | $5,400 | $146,840 |
| 2022 | $5,316 | $152,240 | $5,400 | $146,840 |
| 2021 | $3,503 | $99,486 | $5,407 | $94,079 |
| 2020 | $3,605 | $99,486 | $5,407 | $94,079 |
| 2019 | $3,595 | $99,486 | $5,407 | $94,079 |
| 2018 | $3,512 | $99,486 | $5,407 | $94,079 |
| 2017 | $3,458 | $99,486 | $5,407 | $94,079 |
| 2016 | $3,429 | $98,289 | $4,210 | $94,079 |
| 2015 | -- | $98,289 | $4,210 | $94,079 |
| 2014 | -- | $93,334 | $4,210 | $89,124 |
| 2013 | -- | $93,333 | $4,210 | $89,123 |
Source: Public Records
Map
Nearby Homes
- 5147 Doverel Hwy
- 3418 New Hope Trail
- 300 Five Forks Rd
- 3109 Calhoun St
- 0 Carver St
- 48 Cheney St
- 00 Hwy 41
- 0 William Avera Rd
- 13XX Graves Hwy
- 33895 Ga-45
- 145 Pearson Dr SW
- Cordrays Mill S
- 229 7th Ave NW
- Sam Bentley Rd
- 414 2nd Ave SE
- 361/552 NW Tenth Ave
- 226 N Main St
- 411 E Lee St
- 439 Cherry St SE
- 567 E Lee St
Your Personal Tour Guide
Ask me questions while you tour the home.