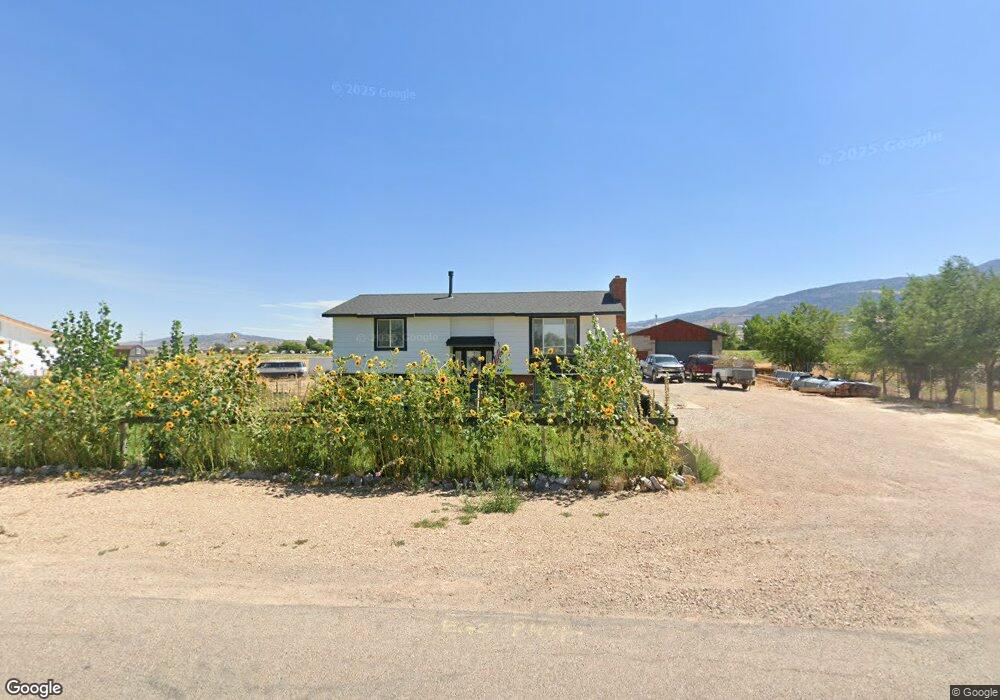
4496 N Blue Sky Dr E Unit Approeved SS $70k 11 Cedar City, UT 84721
Estimated Value: $302,091 - $334,000
--
Bed
1
Bath
1,018
Sq Ft
$314/Sq Ft
Est. Value
About This Home
This home is located at 4496 N Blue Sky Dr E Unit Approeved SS $70k 11, Cedar City, UT 84721 and is currently estimated at $319,523, approximately $313 per square foot. 4496 N Blue Sky Dr E Unit Approeved SS $70k 11 is a home located in Iron County with nearby schools including Enoch School, Cedar Middle School, and Cedar City High School.
Create a Home Valuation Report for This Property
The Home Valuation Report is an in-depth analysis detailing your home's value as well as a comparison with similar homes in the area
Home Values in the Area
Average Home Value in this Area
Tax History Compared to Growth
Tax History
| Year | Tax Paid | Tax Assessment Tax Assessment Total Assessment is a certain percentage of the fair market value that is determined by local assessors to be the total taxable value of land and additions on the property. | Land | Improvement |
|---|---|---|---|---|
| 2025 | $1,132 | $155,155 | $45,650 | $109,505 |
| 2023 | $1,153 | $145,040 | $43,770 | $101,270 |
| 2022 | $1,144 | $133,750 | $41,685 | $92,065 |
| 2021 | $866 | $101,240 | $24,520 | $76,720 |
| 2020 | $884 | $90,790 | $16,300 | $74,490 |
| 2019 | $813 | $79,265 | $14,730 | $64,535 |
| 2018 | $819 | $77,570 | $14,730 | $62,840 |
| 2017 | $1,230 | $122,270 | $26,785 | $95,485 |
| 2016 | $1,172 | $108,450 | $22,825 | $85,625 |
Source: Public Records
Map
Nearby Homes
- 723 E Rose Ln
- 4355 N Maple Ln
- 7 Acre Ft 1963 Priority Date
- 4509 N Gold Dust Trail St
- 4889 N Springfield Cir Unit lot 15
- 4886 N Springfield Cir Unit lot 13
- 4960 N Minersville Hwy
- 927 E Winchester Dr
- 4953 N Winchester Dr
- 4125 N Minersville Hwy
- 4961 N Winchester Dr
- 4793 N Utah Trail
- 1021 E 4290 N Unit (Lot 2 Phs 4 Settler
- 965 E Winchester Dr
- 4947 N Remington Rd
- 4947 N Remington Rd Unit lot 58
- 4496 N Blue Sky Dr E
- 4508 N Blue Sky Dr E
- 4480 N Blue Sky Dr E
- 4500 N Blue Sky Dr E
- 4525 N Blue Sky Dr E
- 4469 N Blue Sky Dr E
- 4462 N Blue Sky Dr E
- 4500 E Blue Sky Dr N
- 4496 E Blue Sky Dr N
- 4455 N Blue Sky Dr E
- 4452 N Blue Sky Dr E
- 4496 N Apple Blossom Ln
- 661 E Rose Ln
- Lot 10 N Apple Blossom Ln
- Lot 10 N Apple Blossom Ln Unit 1
- 4443 N Blue Sky Dr E
- 4523 N Apple Blossom Ln
- 677 E Rose Ln
- 611 E Apple Blossom Ln
- 4484 N Apple Blossom Ln