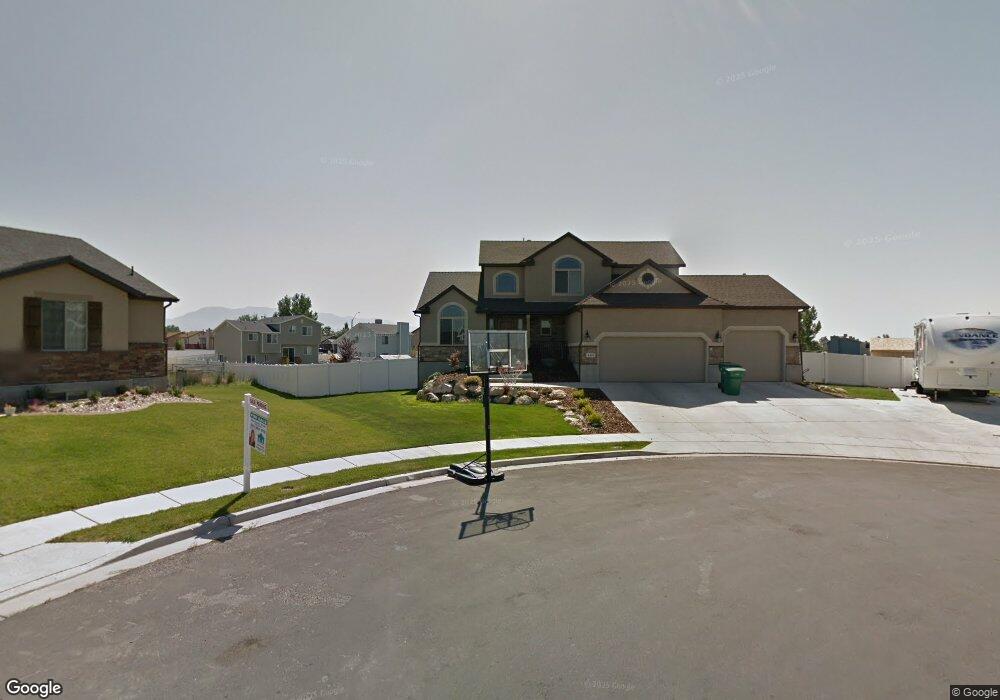
4498 S 3885 W West Haven, UT 84401
Estimated Value: $618,000 - $650,000
4
Beds
4
Baths
3,346
Sq Ft
$189/Sq Ft
Est. Value
About This Home
This home is located at 4498 S 3885 W, West Haven, UT 84401 and is currently estimated at $633,195, approximately $189 per square foot. 4498 S 3885 W is a home located in Weber County with nearby schools including West Haven School, Sand Ridge Junior High School, and Roy High School.
Ownership History
Date
Name
Owned For
Owner Type
Purchase Details
Closed on
Oct 8, 2021
Sold by
Rasor Jeffrey B and Rasor Lori
Bought by
Rasor Jeffrey Bennett and Rasor Lori Ann
Current Estimated Value
Purchase Details
Closed on
Jun 15, 2020
Sold by
Banta Ken A and Banta Lori T
Bought by
Rasor Jeffrey B and Rasor Lori
Home Financials for this Owner
Home Financials are based on the most recent Mortgage that was taken out on this home.
Original Mortgage
$309,900
Outstanding Balance
$274,703
Interest Rate
3.2%
Mortgage Type
New Conventional
Estimated Equity
$358,492
Purchase Details
Closed on
Sep 15, 2011
Sold by
Vanness Brian J
Bought by
Vanness Brian J and Van Ness Julie
Purchase Details
Closed on
Aug 17, 2007
Sold by
Ivory Homes Ltd
Bought by
Banta Ken A and Banta Lori T
Home Financials for this Owner
Home Financials are based on the most recent Mortgage that was taken out on this home.
Original Mortgage
$280,000
Interest Rate
6.62%
Mortgage Type
Purchase Money Mortgage
Create a Home Valuation Report for This Property
The Home Valuation Report is an in-depth analysis detailing your home's value as well as a comparison with similar homes in the area
Home Values in the Area
Average Home Value in this Area
Purchase History
| Date | Buyer | Sale Price | Title Company |
|---|---|---|---|
| Rasor Jeffrey Bennett | -- | None Available | |
| Rasor Jeffrey B | -- | North Amer Ttl Ut Bountiful | |
| Vanness Brian J | -- | Hickman Land Title Company | |
| Banta Ken A | -- | Cottonwood Title Insurance A |
Source: Public Records
Mortgage History
| Date | Status | Borrower | Loan Amount |
|---|---|---|---|
| Open | Rasor Jeffrey B | $309,900 | |
| Previous Owner | Banta Ken A | $280,000 |
Source: Public Records
Tax History Compared to Growth
Tax History
| Year | Tax Paid | Tax Assessment Tax Assessment Total Assessment is a certain percentage of the fair market value that is determined by local assessors to be the total taxable value of land and additions on the property. | Land | Improvement |
|---|---|---|---|---|
| 2025 | $3,714 | $609,249 | $148,016 | $461,233 |
| 2024 | $3,549 | $328,898 | $81,408 | $247,490 |
| 2023 | $3,811 | $355,850 | $81,409 | $274,441 |
| 2022 | $3,609 | $344,850 | $81,409 | $263,441 |
| 2021 | $3,073 | $492,000 | $63,761 | $428,239 |
| 2020 | $2,872 | $420,000 | $48,224 | $371,776 |
| 2019 | $2,900 | $402,000 | $55,918 | $346,082 |
| 2018 | $3,005 | $400,000 | $51,178 | $348,822 |
| 2017 | $2,550 | $326,000 | $60,470 | $265,530 |
| 2016 | $2,389 | $165,330 | $25,323 | $140,007 |
| 2015 | $2,307 | $158,663 | $25,323 | $133,340 |
| 2014 | $2,053 | $136,772 | $19,807 | $116,965 |
Source: Public Records
Map
Nearby Homes
- 3692 W 4625 S
- Villages Townhome Plan at Green Farm - Villages
- 4024 W 4650 S
- 3669 W 4625 S
- 3652 W 4625 S
- 3632 W 4650 S
- 3671 W 4700 S
- 3627 W 4650 S
- 4094 W 4700 S
- 4097 W 4750 S
- 3434 W 4525 S
- 4106 W 4875 S
- Poplar Plan at Highgate Cove
- Pando Plan at Highgate Cove
- 4890 S 4075 W
- 4141 W 4875 S
- 4124 S 3560 W
- 3524 W 4835 S Unit 22
- 3820 Foxglen Dr
- 4756 S 4300 W