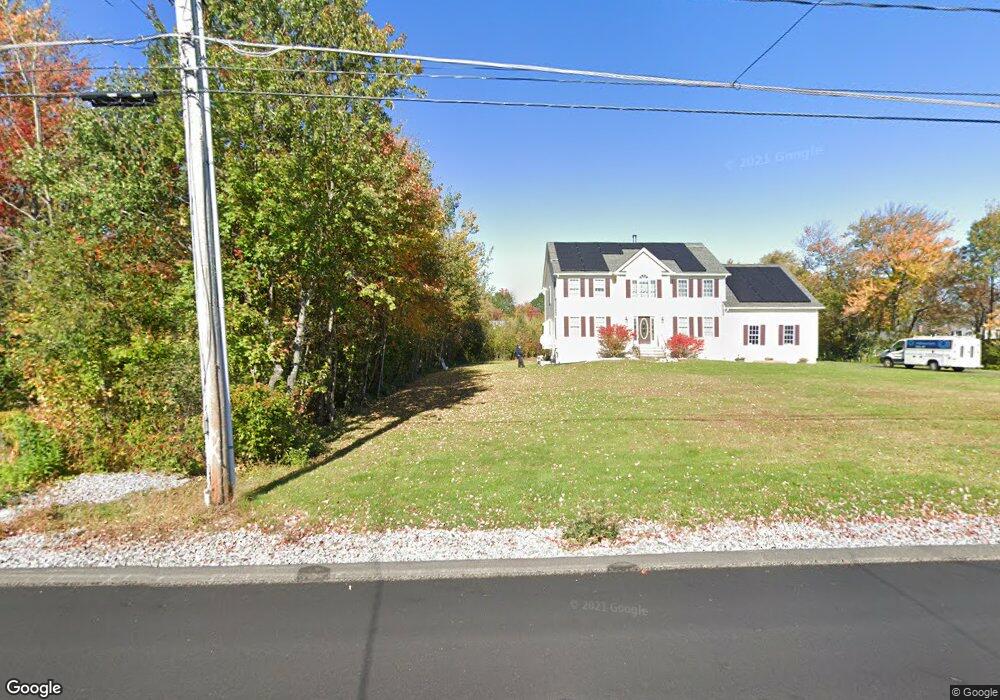
449R W Pearl Rd Torrington, CT 06790
Estimated Value: $370,000 - $475,000
3
Beds
3
Baths
2,347
Sq Ft
$186/Sq Ft
Est. Value
About This Home
This home is located at 449R W Pearl Rd, Torrington, CT 06790 and is currently estimated at $436,346, approximately $185 per square foot. 449R W Pearl Rd is a home located in Litchfield County with nearby schools including Torrington Middle School, Torrington High School, and Torrington Christian Academy.
Ownership History
Date
Name
Owned For
Owner Type
Purchase Details
Closed on
Jul 31, 2024
Sold by
Butkus Keith
Bought by
Butkus Christopher and Verrastro Katie A
Current Estimated Value
Home Financials for this Owner
Home Financials are based on the most recent Mortgage that was taken out on this home.
Original Mortgage
$297,000
Outstanding Balance
$293,639
Interest Rate
6.87%
Mortgage Type
Purchase Money Mortgage
Estimated Equity
$142,707
Purchase Details
Closed on
Sep 6, 2016
Sold by
Perreault Leo
Bought by
Butkus Keith
Home Financials for this Owner
Home Financials are based on the most recent Mortgage that was taken out on this home.
Original Mortgage
$250,381
Interest Rate
3.5%
Mortgage Type
FHA
Purchase Details
Closed on
Oct 3, 2003
Sold by
Kieu Thanh and Nguyen Vinh
Bought by
Perreault Leo and Perreault Deborah
Home Financials for this Owner
Home Financials are based on the most recent Mortgage that was taken out on this home.
Original Mortgage
$271,800
Interest Rate
6.25%
Create a Home Valuation Report for This Property
The Home Valuation Report is an in-depth analysis detailing your home's value as well as a comparison with similar homes in the area
Home Values in the Area
Average Home Value in this Area
Purchase History
| Date | Buyer | Sale Price | Title Company |
|---|---|---|---|
| Butkus Christopher | $330,000 | None Available | |
| Butkus Keith | $255,000 | -- | |
| Perreault Leo | $55,500 | -- | |
| Butkus Keith | $255,000 | -- | |
| Perreault Leo | $55,500 | -- |
Source: Public Records
Mortgage History
| Date | Status | Borrower | Loan Amount |
|---|---|---|---|
| Open | Butkus Christopher | $297,000 | |
| Previous Owner | Perreault Leo | $250,381 | |
| Previous Owner | Perreault Leo | $243,100 | |
| Previous Owner | Perreault Leo | $271,800 |
Source: Public Records
Tax History Compared to Growth
Tax History
| Year | Tax Paid | Tax Assessment Tax Assessment Total Assessment is a certain percentage of the fair market value that is determined by local assessors to be the total taxable value of land and additions on the property. | Land | Improvement |
|---|---|---|---|---|
| 2025 | $11,329 | $294,630 | $35,000 | $259,630 |
| 2024 | $9,027 | $188,180 | $35,040 | $153,140 |
| 2023 | $9,025 | $188,180 | $35,040 | $153,140 |
| 2022 | $8,871 | $188,180 | $35,040 | $153,140 |
| 2021 | $8,688 | $188,180 | $35,040 | $153,140 |
| 2020 | $8,688 | $188,180 | $35,040 | $153,140 |
| 2019 | $9,267 | $200,720 | $38,710 | $162,010 |
| 2018 | $9,267 | $200,720 | $38,710 | $162,010 |
| 2017 | $9,183 | $200,720 | $38,710 | $162,010 |
| 2016 | $9,183 | $200,720 | $38,710 | $162,010 |
| 2015 | $9,183 | $200,720 | $38,710 | $162,010 |
| 2014 | $9,605 | $264,460 | $64,610 | $199,850 |
Source: Public Records
Map
Nearby Homes
- 1683 Torringford St
- 70 Suncrest Ct
- 251 Windtree St
- 138 Harrison Rd
- 66 Harrison Rd
- 57 Dibble St
- 96 Berkshire Oval Unit 96
- 158 Cypress Ct Unit 158
- 54 Greenridge Rd
- 302 Gillette Rd
- 290 Gillette Rd
- 179 Greenridge Rd
- 37 Louis Cir
- 2376 Torringford St
- 1229 Winsted Rd Unit 91
- 1275 Winsted Rd Unit 101
- 1275 Winsted Rd Unit 534
- 1275 Winsted Rd Unit 533
- 714 Torringford St
- 1480 Litchfield Turnpike
- 449 W Pearl Rd
- 312 Country Club Rd
- 322 Country Club Rd
- 421 W Pearl Rd
- 300 Country Club Rd
- 1585 Torringford St
- 1573 Torringford St
- 433 W Pearl Rd
- 286 Country Club Rd
- 1605 Torringford St
- 1557 Torringford St
- 274 Country Club Rd
- 1621 Torringford St
- 385 W Pearl Rd
- 1547 Torringford St
- 262 Country Club Rd
- 1533 Torringford St
- 319 Country Club Rd
- 305 Country Club Rd
- 1641 Torringford St