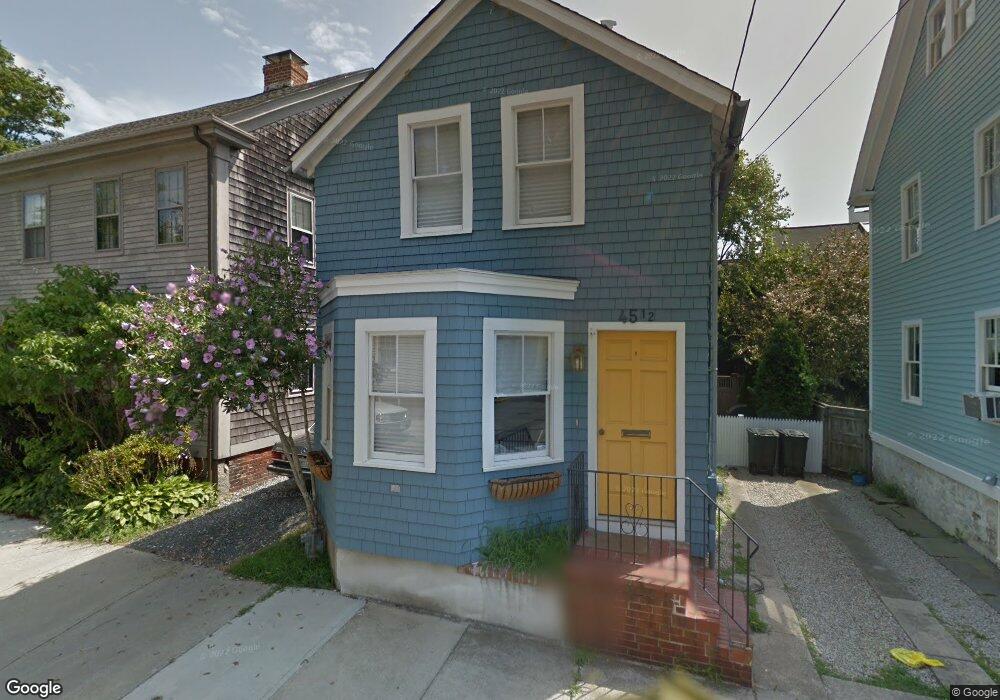
45 1/2 2nd St Newport, RI 02840
Estimated Value: $784,000 - $845,000
2
Beds
2
Baths
858
Sq Ft
$938/Sq Ft
Est. Value
About This Home
This home is located at 45 1/2 2nd St, Newport, RI 02840 and is currently estimated at $804,912, approximately $938 per square foot. 45 1/2 2nd St is a home located in Newport County with nearby schools including Rogers High School, St Michael's Country Day School, and St George's School.
Ownership History
Date
Name
Owned For
Owner Type
Purchase Details
Closed on
Jan 31, 2019
Sold by
Cavanaugh Eugene and Cavanaugh Lori
Bought by
James Henderson Katherine and James Ahughton
Current Estimated Value
Home Financials for this Owner
Home Financials are based on the most recent Mortgage that was taken out on this home.
Original Mortgage
$344,000
Outstanding Balance
$303,048
Interest Rate
4.6%
Mortgage Type
New Conventional
Estimated Equity
$501,864
Create a Home Valuation Report for This Property
The Home Valuation Report is an in-depth analysis detailing your home's value as well as a comparison with similar homes in the area
Home Values in the Area
Average Home Value in this Area
Purchase History
| Date | Buyer | Sale Price | Title Company |
|---|---|---|---|
| James Henderson Katherine | $430,000 | -- |
Source: Public Records
Mortgage History
| Date | Status | Borrower | Loan Amount |
|---|---|---|---|
| Open | James Henderson Katherine | $344,000 |
Source: Public Records
Tax History Compared to Growth
Tax History
| Year | Tax Paid | Tax Assessment Tax Assessment Total Assessment is a certain percentage of the fair market value that is determined by local assessors to be the total taxable value of land and additions on the property. | Land | Improvement |
|---|---|---|---|---|
| 2025 | $5,537 | $637,300 | $408,300 | $229,000 |
| 2024 | $5,239 | $637,300 | $408,300 | $229,000 |
| 2023 | $4,214 | $424,800 | $268,800 | $156,000 |
| 2022 | $4,082 | $424,800 | $268,800 | $156,000 |
| 2021 | $3,963 | $424,800 | $268,800 | $156,000 |
| 2020 | $4,793 | $466,200 | $275,800 | $190,400 |
| 2019 | $4,793 | $466,200 | $275,800 | $190,400 |
| 2018 | $4,657 | $466,200 | $275,800 | $190,400 |
| 2017 | $4,355 | $388,500 | $212,200 | $176,300 |
| 2016 | $4,246 | $388,500 | $212,200 | $176,300 |
| 2015 | $4,145 | $388,500 | $212,200 | $176,300 |
| 2014 | $3,825 | $317,200 | $165,900 | $151,300 |
Source: Public Records
Map
Nearby Homes