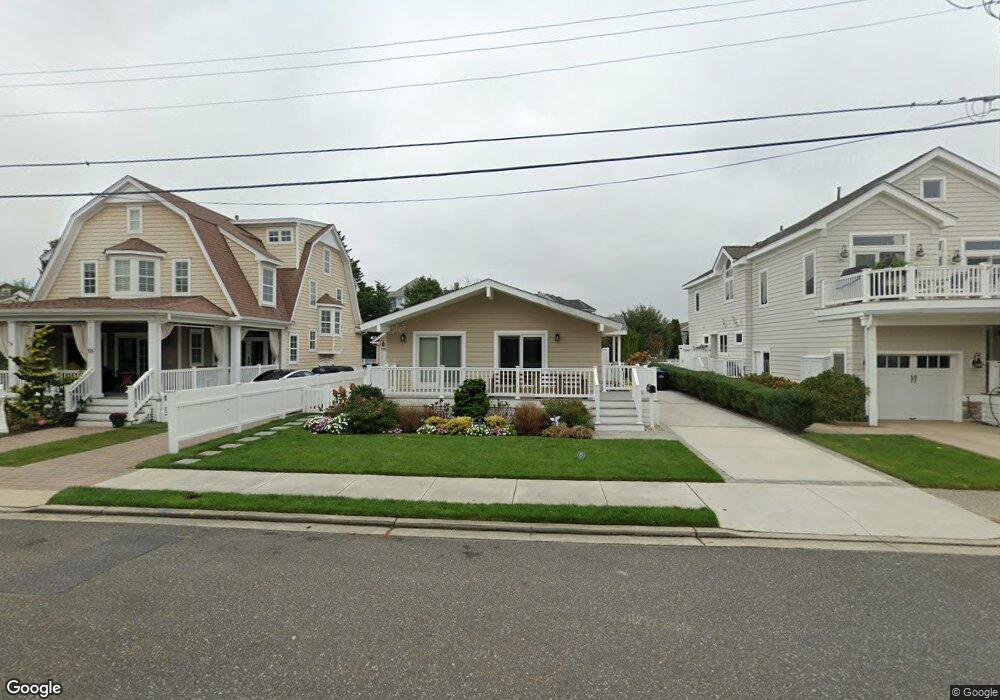
45 10th St E Avalon, NJ 08202
Estimated Value: $3,779,000 - $5,974,000
Studio
--
Bath
4,372
Sq Ft
$1,133/Sq Ft
Est. Value
About This Home
This home is located at 45 10th St E, Avalon, NJ 08202 and is currently estimated at $4,954,777, approximately $1,133 per square foot. 45 10th St E is a home located in Cape May County with nearby schools including Avalon Elementary School.
Ownership History
Date
Name
Owned For
Owner Type
Purchase Details
Closed on
May 16, 2014
Sold by
Sandston Funding I Holdings Ii Llc
Bought by
Trumbour Edward A and Trumbour Georgine G
Current Estimated Value
Purchase Details
Closed on
Nov 6, 2013
Sold by
Demalo James M and Demalo Maria
Bought by
Sandton Fund I Holdings Ii Llc
Purchase Details
Closed on
Jul 21, 1997
Sold by
Beck Lig
Bought by
Demalo James De and Demalo Maria De
Home Financials for this Owner
Home Financials are based on the most recent Mortgage that was taken out on this home.
Original Mortgage
$303,000
Interest Rate
7.55%
Purchase Details
Closed on
Apr 22, 1989
Sold by
Long George and Mary Lynn
Bought by
Beck Leif and Beck Christine
Create a Home Valuation Report for This Property
The Home Valuation Report is an in-depth analysis detailing your home's value as well as a comparison with similar homes in the area
Home Values in the Area
Average Home Value in this Area
Purchase History
| Date | Buyer | Sale Price | Title Company |
|---|---|---|---|
| Trumbour Edward A | $1,800,000 | Seaboard Title Agency | |
| Sandton Fund I Holdings Ii Llc | $881,666 | None Available | |
| Demalo James De | $378,250 | -- | |
| Beck Leif | $480,000 | -- |
Source: Public Records
Mortgage History
| Date | Status | Borrower | Loan Amount |
|---|---|---|---|
| Previous Owner | Demalo James De | $303,000 |
Source: Public Records
Tax History
| Year | Tax Paid | Tax Assessment Tax Assessment Total Assessment is a certain percentage of the fair market value that is determined by local assessors to be the total taxable value of land and additions on the property. | Land | Improvement |
|---|---|---|---|---|
| 2025 | $19,034 | $3,100,000 | $1,887,500 | $1,212,500 |
| 2024 | $19,034 | $3,100,000 | $1,887,500 | $1,212,500 |
| 2023 | $18,879 | $3,100,000 | $1,887,500 | $1,212,500 |
| 2022 | $17,608 | $3,100,000 | $1,887,500 | $1,212,500 |
| 2021 | $16,957 | $3,100,000 | $1,887,500 | $1,212,500 |
| 2020 | $16,834 | $3,100,000 | $1,887,500 | $1,212,500 |
| 2019 | $15,810 | $3,100,000 | $1,887,500 | $1,212,500 |
| 2018 | $16,143 | $3,307,900 | $1,887,500 | $1,420,400 |
| 2017 | $15,557 | $2,798,100 | $1,575,000 | $1,223,100 |
| 2016 | $15,381 | $2,796,600 | $1,575,000 | $1,221,600 |
| 2015 | $15,207 | $1,575,000 | $1,575,000 | $0 |
| 2014 | $9,115 | $1,703,800 | $1,575,000 | $128,800 |
Source: Public Records
Map
Nearby Homes
Your Personal Tour Guide
Ask me questions while you tour the home.