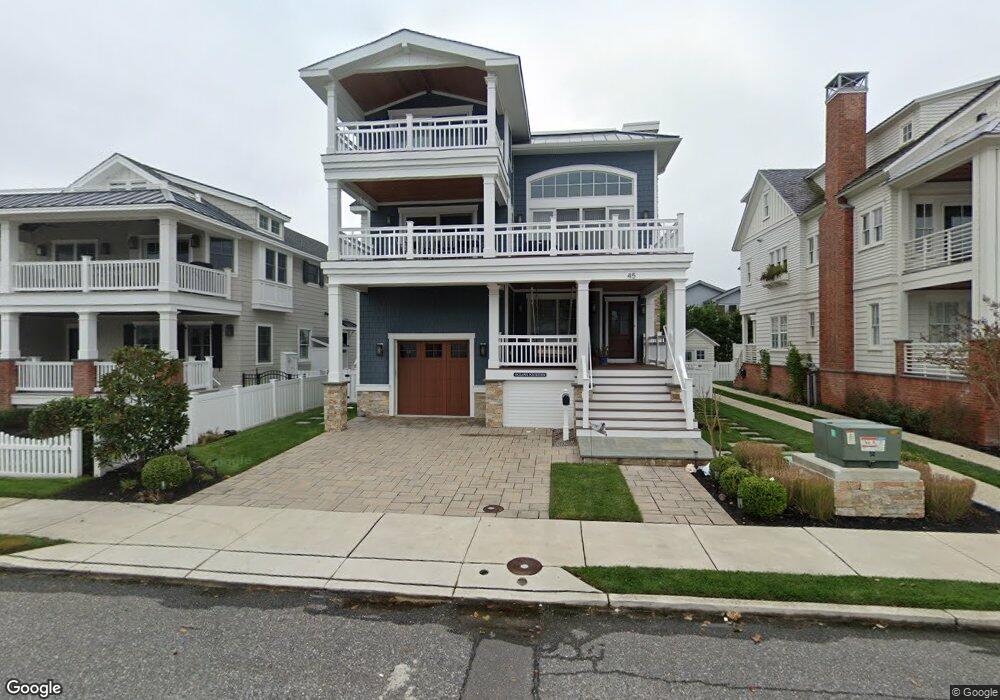
45 14th St W Avalon, NJ 08202
Estimated Value: $3,061,209 - $4,130,000
Studio
--
Bath
2,696
Sq Ft
$1,379/Sq Ft
Est. Value
About This Home
This home is located at 45 14th St W, Avalon, NJ 08202 and is currently estimated at $3,718,052, approximately $1,379 per square foot. 45 14th St W is a home located in Cape May County with nearby schools including Avalon Elementary School.
Ownership History
Date
Name
Owned For
Owner Type
Purchase Details
Closed on
Oct 28, 2011
Sold by
Icenhower Joseph B and Icenhower Judith Mcd
Bought by
Icenhower Joseph B and Icenhower Judith Mcd
Current Estimated Value
Purchase Details
Closed on
Aug 11, 1997
Sold by
Wilkenson Louise Emma
Bought by
Vassalotti Gregory J and Vassalotti Theresa M
Home Financials for this Owner
Home Financials are based on the most recent Mortgage that was taken out on this home.
Original Mortgage
$304,000
Outstanding Balance
$45,646
Interest Rate
7.56%
Estimated Equity
$3,672,406
Create a Home Valuation Report for This Property
The Home Valuation Report is an in-depth analysis detailing your home's value as well as a comparison with similar homes in the area
Home Values in the Area
Average Home Value in this Area
Purchase History
| Date | Buyer | Sale Price | Title Company |
|---|---|---|---|
| Icenhower Joseph B | -- | None Available | |
| Vassalotti Gregory J | $190,000 | -- |
Source: Public Records
Mortgage History
| Date | Status | Borrower | Loan Amount |
|---|---|---|---|
| Open | Vassalotti Gregory J | $304,000 |
Source: Public Records
Tax History Compared to Growth
Tax History
| Year | Tax Paid | Tax Assessment Tax Assessment Total Assessment is a certain percentage of the fair market value that is determined by local assessors to be the total taxable value of land and additions on the property. | Land | Improvement |
|---|---|---|---|---|
| 2025 | $10,636 | $1,732,300 | $1,200,000 | $532,300 |
| 2024 | $10,636 | $1,732,300 | $1,200,000 | $532,300 |
| 2023 | $10,550 | $1,732,300 | $1,200,000 | $532,300 |
| 2022 | $9,839 | $1,732,300 | $1,200,000 | $532,300 |
| 2021 | $9,476 | $1,732,300 | $1,200,000 | $532,300 |
| 2020 | $9,112 | $1,732,300 | $1,200,000 | $532,300 |
| 2019 | $8,835 | $1,732,300 | $1,200,000 | $532,300 |
| 2018 | $8,454 | $1,732,300 | $1,200,000 | $532,300 |
| 2017 | $7,706 | $1,385,900 | $900,000 | $485,900 |
| 2016 | $7,622 | $1,385,900 | $900,000 | $485,900 |
| 2015 | $7,498 | $1,385,900 | $900,000 | $485,900 |
| 2014 | $7,415 | $1,385,900 | $900,000 | $485,900 |
Source: Public Records
Map
Nearby Homes