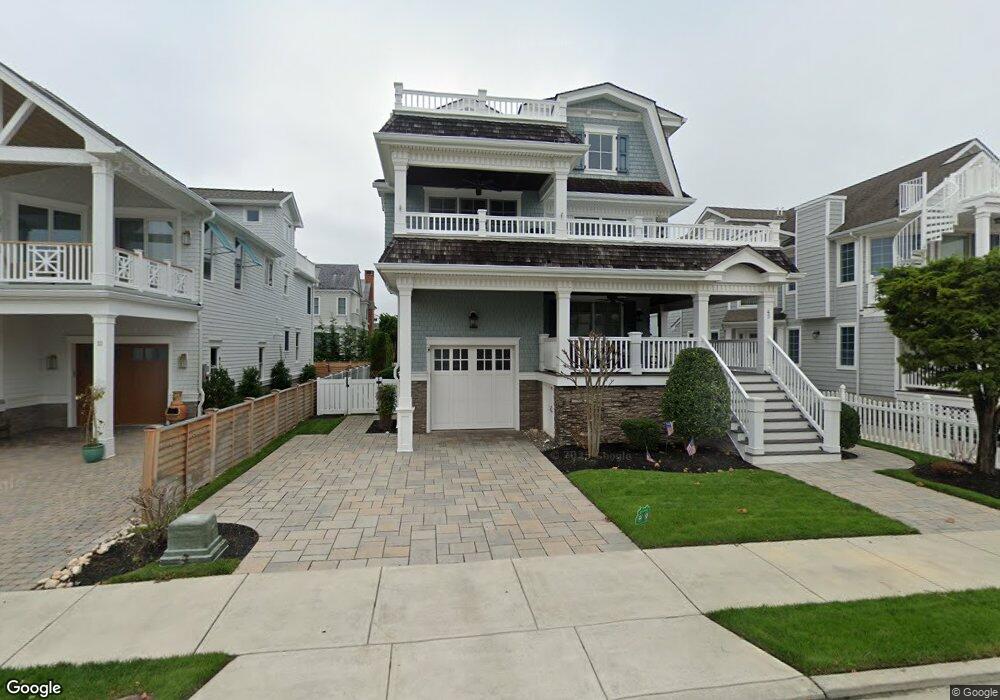
45 15th St E Avalon, NJ 08202
Estimated Value: $5,116,000 - $6,288,176
Studio
--
Bath
3,619
Sq Ft
$1,558/Sq Ft
Est. Value
About This Home
This home is located at 45 15th St E, Avalon, NJ 08202 and is currently estimated at $5,640,044, approximately $1,558 per square foot. 45 15th St E is a home located in Cape May County with nearby schools including Avalon Elementary School.
Ownership History
Date
Name
Owned For
Owner Type
Purchase Details
Closed on
Oct 26, 2021
Sold by
Gdovin John J
Bought by
John J Gdovin Irt
Current Estimated Value
Purchase Details
Closed on
Aug 23, 2021
Sold by
Gdovicb John J and Gdovin Barbara
Bought by
Gdovicb John J
Purchase Details
Closed on
Jun 1, 2017
Sold by
45 East 15Th St Llc
Bought by
Gdovin John Joseph and Gdovin Barbara
Purchase Details
Closed on
Dec 11, 2012
Sold by
Oberg Maureen T and Groff Ronald P
Bought by
45 East 15Th St Llc
Create a Home Valuation Report for This Property
The Home Valuation Report is an in-depth analysis detailing your home's value as well as a comparison with similar homes in the area
Home Values in the Area
Average Home Value in this Area
Purchase History
| Date | Buyer | Sale Price | Title Company |
|---|---|---|---|
| John J Gdovin Irt | -- | None Available | |
| John J Gdovin 2021 Irrevocable Spousal Trust | -- | None Listed On Document | |
| Gdovicb John J | -- | None Available | |
| Gdovin John Joseph | $3,245,000 | None Available | |
| 45 East 15Th St Llc | $1,563,333 | None Available |
Source: Public Records
Tax History
| Year | Tax Paid | Tax Assessment Tax Assessment Total Assessment is a certain percentage of the fair market value that is determined by local assessors to be the total taxable value of land and additions on the property. | Land | Improvement |
|---|---|---|---|---|
| 2025 | $18,580 | $3,026,100 | $1,700,000 | $1,326,100 |
| 2024 | $18,580 | $3,026,100 | $1,700,000 | $1,326,100 |
Source: Public Records
Map
Nearby Homes
Your Personal Tour Guide
Ask me questions while you tour the home.