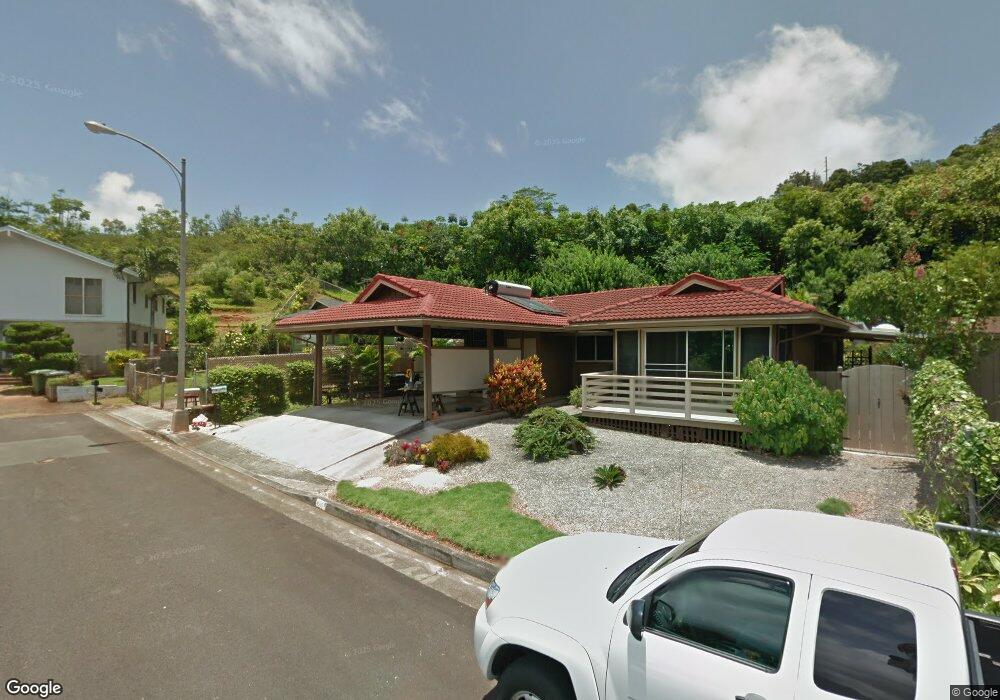
45-163 Neepapa Place Kaneohe, HI 96744
Estimated Value: $1,242,511 - $1,406,000
5
Beds
2
Baths
2,048
Sq Ft
$645/Sq Ft
Est. Value
About This Home
This home is located at 45-163 Neepapa Place, Kaneohe, HI 96744 and is currently estimated at $1,321,378, approximately $645 per square foot. 45-163 Neepapa Place is a home located in Honolulu County with nearby schools including Puohala Elementary School, Governor Samuel Wilder King Intermediate School, and Castle High School.
Ownership History
Date
Name
Owned For
Owner Type
Purchase Details
Closed on
Oct 30, 2023
Sold by
Tamashiro Jason Troy Fukuo
Bought by
Tamashiro Jason Troy Fukuo and Ng Teri Shizuko
Current Estimated Value
Purchase Details
Closed on
Jan 20, 2022
Sold by
Tamashiro Sharon Sachiko
Bought by
Ng Teri Shizuko Tama and Ng Clarence Kai
Purchase Details
Closed on
Jan 12, 2022
Sold by
Tamashiro Sharon S and Sharon S Tamashiro Trust
Bought by
Tamashiro Sharon Sachiko
Purchase Details
Closed on
Oct 13, 2005
Sold by
Tamashiro Sharon S
Bought by
Tamashiro Sharon S and Sharon S Tamashiro Revocable Living Tr
Purchase Details
Closed on
Jun 2, 1995
Sold by
Tamashiro Walter Katsutoshi and Tamashiro Sharon Sachiko
Bought by
Tamashiro Walter K and Tamashiro Sharon S
Create a Home Valuation Report for This Property
The Home Valuation Report is an in-depth analysis detailing your home's value as well as a comparison with similar homes in the area
Home Values in the Area
Average Home Value in this Area
Purchase History
| Date | Buyer | Sale Price | Title Company |
|---|---|---|---|
| Tamashiro Jason Troy Fukuo | -- | None Listed On Document | |
| Tamashiro Sharon Sachiko | -- | None Listed On Document | |
| Tamashiro Sharon Sachiko | -- | None Listed On Document | |
| Ng Teri Shizuko Tama | $175,000 | None Listed On Document | |
| Ng Teri Shizuko Tama | $175,000 | Suzuki Scott C | |
| Ng Teri Shizuko Tama | $175,000 | Suzuki Scott C | |
| Tamashiro Sharon Sachiko | -- | None Available | |
| Tamashiro Sharon Sachiko | -- | None Available | |
| Tamashiro Sharon Sachiko | -- | None Available | |
| Tamashiro Sharon S | -- | None Available | |
| Tamashiro Walter K | -- | -- |
Source: Public Records
Tax History Compared to Growth
Tax History
| Year | Tax Paid | Tax Assessment Tax Assessment Total Assessment is a certain percentage of the fair market value that is determined by local assessors to be the total taxable value of land and additions on the property. | Land | Improvement |
|---|---|---|---|---|
| 2025 | $3,019 | $1,132,500 | $930,200 | $202,300 |
| 2024 | $3,019 | $1,022,500 | $852,700 | $169,800 |
| 2023 | $3,447 | $1,224,900 | $894,200 | $330,700 |
| 2022 | $3,353 | $1,098,000 | $832,000 | $266,000 |
| 2021 | $3,087 | $1,022,100 | $788,200 | $233,900 |
| 2020 | $2,986 | $993,200 | $805,700 | $187,500 |
| 2019 | $2,830 | $979,000 | $788,200 | $190,800 |
| 2018 | $2,830 | $928,500 | $788,200 | $140,300 |
| 2017 | $2,685 | $887,100 | $683,100 | $204,000 |
| 2016 | $2,395 | $856,600 | $683,100 | $173,500 |
| 2015 | $2,308 | $779,400 | $613,100 | $166,300 |
| 2014 | -- | $793,000 | $528,400 | $264,600 |
Source: Public Records
Map
Nearby Homes
- 45-20 Namoku St
- 45-234 Kokokahi Place Unit A
- 45-340 Lehuuila St
- 45-151 Kokokahi Place
- 45-38 Holowai Place
- 44-713 Puamohala St
- 45-407 Mokulele Dr Unit 60
- 45-433 Akimala St
- 45-456 Ihilani St
- 45-333 Mahalani St
- 45-513 Duncan Dr
- 45-519 Kamehameha Hwy
- 1 Kamehameha Hwy
- 45-756 Kamehameha Hwy
- 45-995 Wailele Rd Unit 55
- 45-995 Wailele Rd Unit 35
- 45-995 Wailele Rd Unit 29
- 45-995 Wailele Rd Unit 8
- 45-532 Kapalai Rd
- 45-560 Kiani St
- 45-165 Neepapa Place
- 45-161 Neepapa Place
- 45-162 Neepapa Place
- 45-164 Neepapa Place
- 45-40 Namoku St
- 45-030 Namoku St
- 45-166 Neepapa Place
- 45-54 Namoku St
- 45-163 Neepu Place
- 45-30 Namoku St
- 45-164 Neemua Place
- 45-166 Neemua Place
- 45-162 Neemua Place
- 45-167 Neepu Place
- 45-160 Moakaka Way
- 45-168 Neemua Place
- 45-161 Neepu Place
- 45-158 Moakaka Way
- 45-201 Nohonani Place
- 45-27 Namoku St