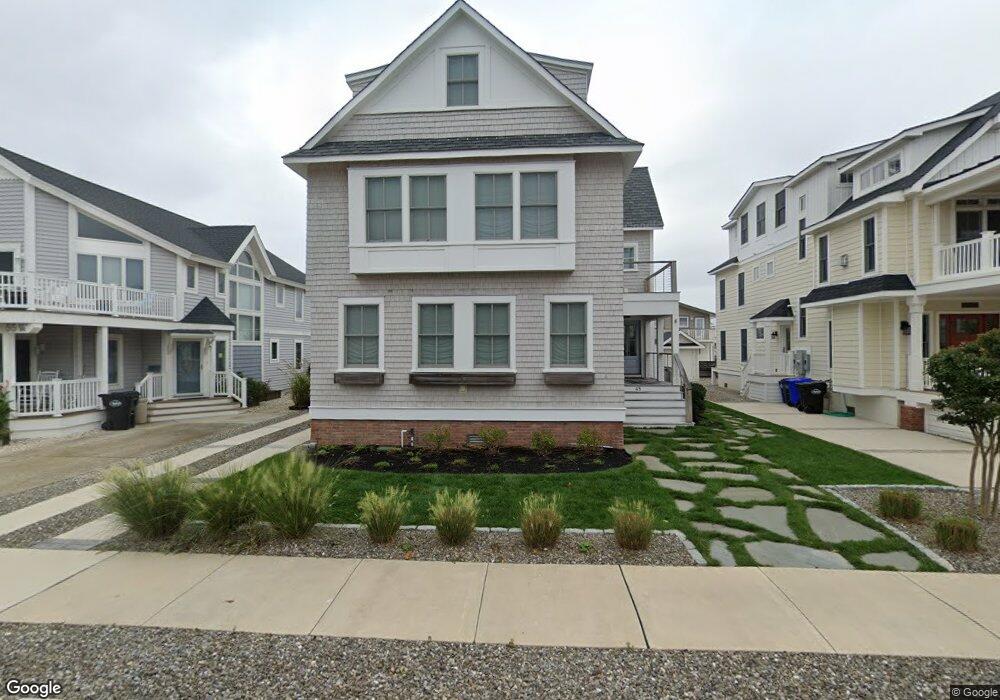
45 18th St W Avalon, NJ 08202
Estimated Value: $3,120,000 - $5,162,786
Studio
--
Bath
1,505
Sq Ft
$2,752/Sq Ft
Est. Value
About This Home
This home is located at 45 18th St W, Avalon, NJ 08202 and is currently estimated at $4,142,197, approximately $2,752 per square foot. 45 18th St W is a home located in Cape May County with nearby schools including Avalon Elementary School.
Ownership History
Date
Name
Owned For
Owner Type
Purchase Details
Closed on
Oct 24, 2017
Sold by
Bishop John B
Bought by
Oakes Joseph J
Current Estimated Value
Purchase Details
Closed on
May 6, 1997
Sold by
Arace Michael J
Bought by
Bishop John B
Home Financials for this Owner
Home Financials are based on the most recent Mortgage that was taken out on this home.
Original Mortgage
$100,000
Interest Rate
8.08%
Purchase Details
Closed on
Apr 13, 1991
Sold by
Gutekunst Neil T and Gutekunst Teresa A
Bought by
Arace Michael and Arace Isabelle
Create a Home Valuation Report for This Property
The Home Valuation Report is an in-depth analysis detailing your home's value as well as a comparison with similar homes in the area
Home Values in the Area
Average Home Value in this Area
Purchase History
| Date | Buyer | Sale Price | Title Company |
|---|---|---|---|
| Oakes Joseph J | $1,435,000 | Seaboard Title Agency | |
| Bishop John B | $265,000 | -- | |
| Arace Michael | $225,000 | -- |
Source: Public Records
Mortgage History
| Date | Status | Borrower | Loan Amount |
|---|---|---|---|
| Previous Owner | Bishop John B | $100,000 |
Source: Public Records
Tax History
| Year | Tax Paid | Tax Assessment Tax Assessment Total Assessment is a certain percentage of the fair market value that is determined by local assessors to be the total taxable value of land and additions on the property. | Land | Improvement |
|---|---|---|---|---|
| 2025 | $19,320 | $3,146,600 | $1,200,000 | $1,946,600 |
| 2024 | $19,320 | $3,146,600 | $1,200,000 | $1,946,600 |
| 2023 | $19,163 | $3,146,600 | $1,200,000 | $1,946,600 |
| 2022 | $17,873 | $3,146,600 | $1,200,000 | $1,946,600 |
| 2021 | $6,564 | $1,200,000 | $1,200,000 | $0 |
| 2020 | $6,446 | $1,225,400 | $1,200,000 | $25,400 |
| 2019 | $6,250 | $1,225,400 | $1,200,000 | $25,400 |
| 2018 | $5,980 | $1,225,400 | $1,200,000 | $25,400 |
| 2017 | $5,165 | $929,000 | $900,000 | $29,000 |
| 2016 | $5,110 | $929,000 | $900,000 | $29,000 |
| 2015 | $5,026 | $929,000 | $900,000 | $29,000 |
| 2014 | $4,970 | $929,000 | $900,000 | $29,000 |
Source: Public Records
Map
Nearby Homes
Your Personal Tour Guide
Ask me questions while you tour the home.