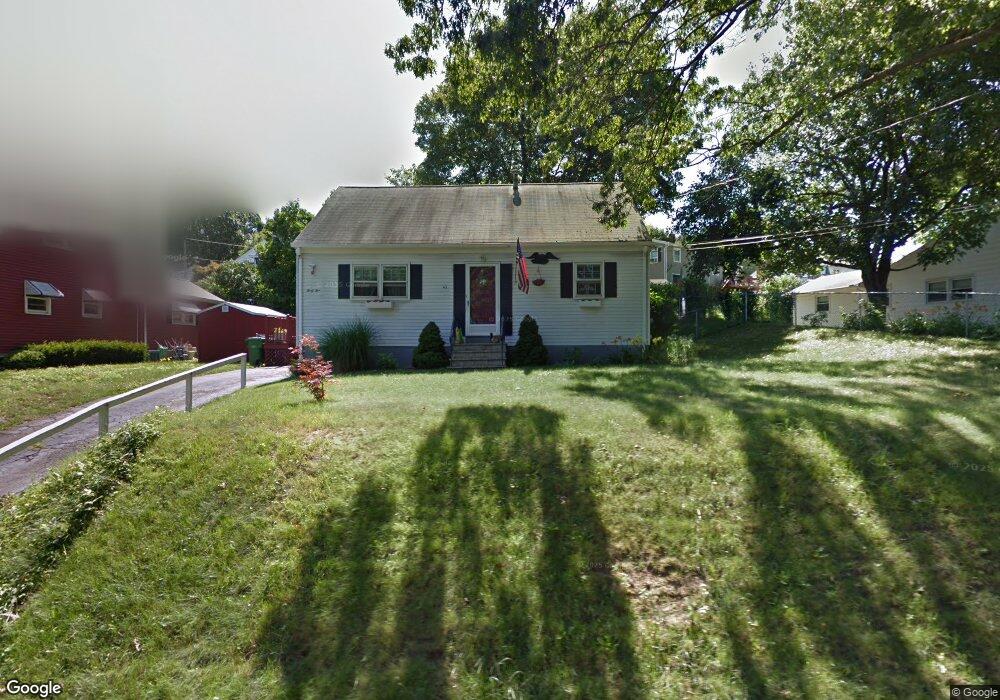
45 3rd St Wallingford, CT 06492
Estimated Value: $256,000 - $353,000
3
Beds
1
Bath
1,142
Sq Ft
$284/Sq Ft
Est. Value
About This Home
This home is located at 45 3rd St, Wallingford, CT 06492 and is currently estimated at $324,066, approximately $283 per square foot. 45 3rd St is a home located in New Haven County with nearby schools including Moses Y Beach Elementary School, Rock Hill Elementary School, and Dag Hammarskjold Middle School.
Ownership History
Date
Name
Owned For
Owner Type
Purchase Details
Closed on
Sep 9, 2010
Sold by
Raby Gerald J and Raby Linda M
Bought by
Bazzano Cathleen S
Current Estimated Value
Home Financials for this Owner
Home Financials are based on the most recent Mortgage that was taken out on this home.
Original Mortgage
$85,000
Interest Rate
4.55%
Purchase Details
Closed on
Jul 5, 2001
Sold by
Mccomb Michael A and Mccomb Fatima M
Bought by
Raby Gerald J and Raby Linda M
Purchase Details
Closed on
Dec 28, 1992
Sold by
Gerosa Etta J
Bought by
Mccomb Michael A and Fieritas Fatima M
Create a Home Valuation Report for This Property
The Home Valuation Report is an in-depth analysis detailing your home's value as well as a comparison with similar homes in the area
Home Values in the Area
Average Home Value in this Area
Purchase History
| Date | Buyer | Sale Price | Title Company |
|---|---|---|---|
| Bazzano Cathleen S | $106,275 | -- | |
| Bazzano Cathleen S | $106,275 | -- | |
| Raby Gerald J | $137,500 | -- | |
| Raby Gerald J | $137,500 | -- | |
| Mccomb Michael A | $109,000 | -- | |
| Mccomb Michael A | $109,000 | -- |
Source: Public Records
Mortgage History
| Date | Status | Borrower | Loan Amount |
|---|---|---|---|
| Closed | Mccomb Michael A | $85,000 | |
| Previous Owner | Mccomb Michael A | $132,000 |
Source: Public Records
Tax History
| Year | Tax Paid | Tax Assessment Tax Assessment Total Assessment is a certain percentage of the fair market value that is determined by local assessors to be the total taxable value of land and additions on the property. | Land | Improvement |
|---|---|---|---|---|
| 2025 | $4,631 | $192,000 | $74,300 | $117,700 |
| 2024 | $4,007 | $130,700 | $62,000 | $68,700 |
| 2023 | $3,835 | $130,700 | $62,000 | $68,700 |
| 2022 | $3,796 | $130,700 | $62,000 | $68,700 |
| 2021 | $3,728 | $130,700 | $62,000 | $68,700 |
| 2020 | $3,783 | $129,600 | $66,500 | $63,100 |
| 2019 | $100,881 | $129,600 | $66,500 | $63,100 |
| 2018 | $3,712 | $129,600 | $66,500 | $63,100 |
| 2017 | $3,700 | $129,600 | $66,500 | $63,100 |
| 2016 | $3,615 | $129,600 | $66,500 | $63,100 |
| 2015 | $3,651 | $132,900 | $66,500 | $66,400 |
| 2014 | $3,574 | $132,900 | $66,500 | $66,400 |
Source: Public Records
Map
Nearby Homes
- 570 N Main St
- 71 Cedar Ln
- 39 Farm Hill Rd
- 108 N Whittlesey Ave
- 85 N Colony St
- 1 Dean Dr
- 54 Claremont Ave
- 42 S Cherry St Unit 238
- 42 S Cherry St Unit 307
- 46 S Cherry St Unit 245
- 90 Masonic Ave
- 17 Evergreene Unit 17
- 230 Main St Unit 38
- 230 Main St Unit 18
- 120 S Cherry St
- 2 Twin Pines Dr
- 30 Clinton Place
- 147 Constitution St
- 134 E Main St
- 30 King St
Your Personal Tour Guide
Ask me questions while you tour the home.