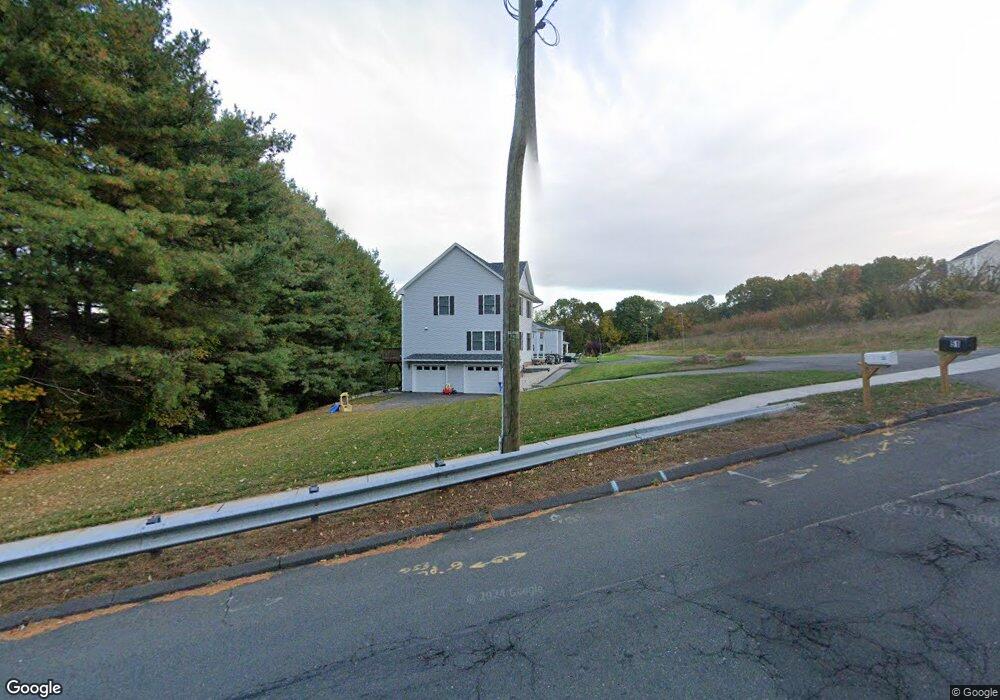
45-51 Loper St Southington, CT 06489
East Southington NeighborhoodEstimated Value: $563,154 - $606,000
3
Beds
3
Baths
1,876
Sq Ft
$311/Sq Ft
Est. Value
About This Home
This home is located at 45-51 Loper St, Southington, CT 06489 and is currently estimated at $582,539, approximately $310 per square foot. 45-51 Loper St is a home located in Hartford County with nearby schools including Reuben E. Thalberg Elementary School, Joseph A. Depaolo Middle School, and Southington High School.
Ownership History
Date
Name
Owned For
Owner Type
Purchase Details
Closed on
Sep 9, 2021
Sold by
Ace Building & Design Llc
Bought by
Patwa Tasveer and Shah Niky
Current Estimated Value
Home Financials for this Owner
Home Financials are based on the most recent Mortgage that was taken out on this home.
Original Mortgage
$303,800
Outstanding Balance
$276,435
Interest Rate
2.8%
Mortgage Type
Purchase Money Mortgage
Estimated Equity
$306,104
Create a Home Valuation Report for This Property
The Home Valuation Report is an in-depth analysis detailing your home's value as well as a comparison with similar homes in the area
Home Values in the Area
Average Home Value in this Area
Purchase History
| Date | Buyer | Sale Price | Title Company |
|---|---|---|---|
| Patwa Tasveer | $405,100 | None Available | |
| Patwa Tasveer | $405,100 | None Available |
Source: Public Records
Mortgage History
| Date | Status | Borrower | Loan Amount |
|---|---|---|---|
| Open | Patwa Tasveer | $303,800 | |
| Closed | Patwa Tasveer | $303,800 |
Source: Public Records
Tax History Compared to Growth
Tax History
| Year | Tax Paid | Tax Assessment Tax Assessment Total Assessment is a certain percentage of the fair market value that is determined by local assessors to be the total taxable value of land and additions on the property. | Land | Improvement |
|---|---|---|---|---|
| 2025 | $7,634 | $229,870 | $47,430 | $182,440 |
| 2024 | $7,227 | $229,870 | $47,430 | $182,440 |
| 2023 | $6,979 | $229,870 | $47,430 | $182,440 |
| 2022 | $6,696 | $229,870 | $47,430 | $182,440 |
| 2021 | $3,249 | $111,910 | $47,430 | $64,480 |
| 2020 | $1,878 | $61,310 | $61,310 | $0 |
| 2019 | $1,879 | $61,310 | $61,310 | $0 |
| 2018 | $1,869 | $61,310 | $61,310 | $0 |
| 2017 | $1,869 | $61,310 | $61,310 | $0 |
Source: Public Records
Map
Nearby Homes
- 81 Laning St
- 285 Queen St Unit 4F
- 273 Queen St Unit 9A
- 31 Erica Ct
- 71 Woodberry Hill Dr
- 7 Meadow Rd
- 19 Malcein Dr
- 25 Whippoorwill Rd
- 554 Spring St
- 138 Butler Ave
- 45 Hart St
- 76 Kane St
- 217 Dunham St Unit TRLR 38
- 217 Dunham St Unit TRLR 32
- 47 Gannet Dr
- 228 Pattonwood Dr
- 1198 Flanders Rd
- 27 Brookside Dr
- 26 Cedar Dr
- 16 Brookside Dr