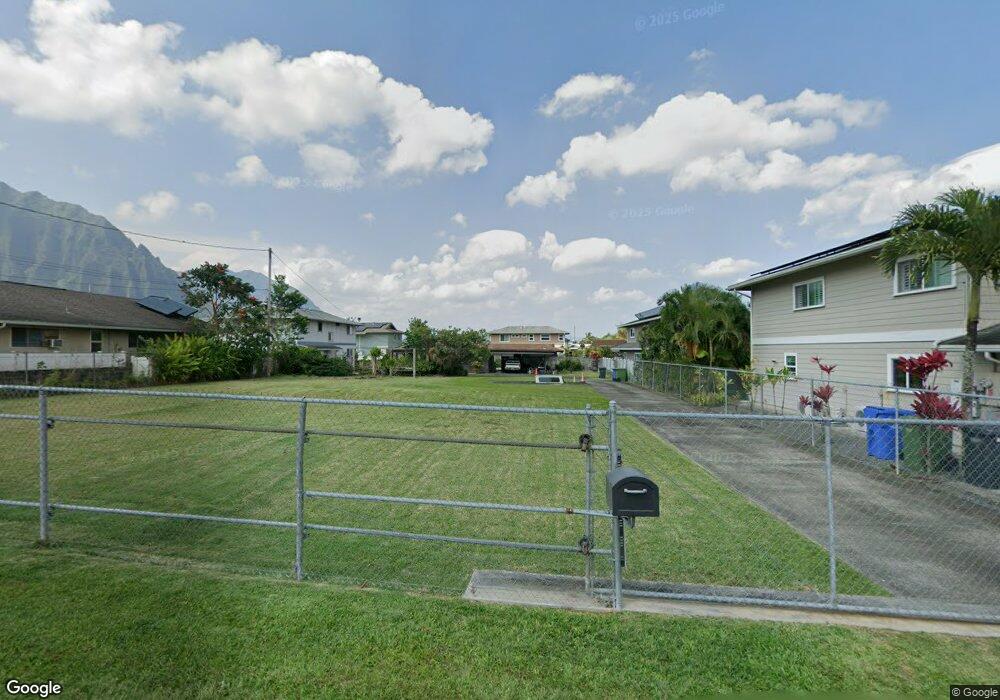
45-535 Halekou Rd Unit 1B Kaneohe, HI 96744
Estimated Value: $1,034,000 - $1,556,000
4
Beds
3
Baths
1,152
Sq Ft
$1,071/Sq Ft
Est. Value
About This Home
This home is located at 45-535 Halekou Rd Unit 1B, Kaneohe, HI 96744 and is currently estimated at $1,233,431, approximately $1,070 per square foot. 45-535 Halekou Rd Unit 1B is a home located in Honolulu County with nearby schools including Kaneohe Elementary School, Governor Samuel Wilder King Intermediate School, and Castle High School.
Ownership History
Date
Name
Owned For
Owner Type
Purchase Details
Closed on
Apr 22, 2021
Sold by
Samura Jayson Y and Samura Diana T
Bought by
Samura Jayson Yoshi and Samura Vivian Kim
Current Estimated Value
Home Financials for this Owner
Home Financials are based on the most recent Mortgage that was taken out on this home.
Original Mortgage
$445,000
Outstanding Balance
$401,781
Interest Rate
3%
Mortgage Type
New Conventional
Estimated Equity
$831,650
Purchase Details
Closed on
Jul 24, 2007
Sold by
Koki Stanley Tsutomu and Koki Donna Mikki
Bought by
Samura Jayson Y and Samura Diana T
Home Financials for this Owner
Home Financials are based on the most recent Mortgage that was taken out on this home.
Original Mortgage
$485,000
Interest Rate
6.73%
Mortgage Type
Unknown
Create a Home Valuation Report for This Property
The Home Valuation Report is an in-depth analysis detailing your home's value as well as a comparison with similar homes in the area
Home Values in the Area
Average Home Value in this Area
Purchase History
| Date | Buyer | Sale Price | Title Company |
|---|---|---|---|
| Samura Jayson Yoshi | -- | Fntic | |
| Samura Jayson Yoshi | -- | Fntic | |
| Samura Jayson Yoshi | -- | Fntic | |
| Samura Jayson Y | $635,000 | Or |
Source: Public Records
Mortgage History
| Date | Status | Borrower | Loan Amount |
|---|---|---|---|
| Open | Samura Jayson Yoshi | $445,000 | |
| Closed | Samura Jayson Yoshi | $445,000 | |
| Closed | Samura Jayson Y | $485,000 |
Source: Public Records
Tax History Compared to Growth
Tax History
| Year | Tax Paid | Tax Assessment Tax Assessment Total Assessment is a certain percentage of the fair market value that is determined by local assessors to be the total taxable value of land and additions on the property. | Land | Improvement |
|---|---|---|---|---|
| 2025 | $5,414 | $1,182,000 | $676,500 | $505,500 |
| 2024 | $5,414 | $1,124,000 | $634,200 | $489,800 |
| 2023 | $4,583 | $1,175,800 | $658,700 | $517,100 |
| 2022 | $4,583 | $1,007,900 | $583,500 | $424,400 |
| 2021 | $2,656 | $898,900 | $537,000 | $361,900 |
| 2020 | $2,551 | $868,800 | $494,500 | $374,300 |
| 2019 | $2,489 | $831,200 | $474,700 | $356,500 |
| 2018 | $2,233 | $758,000 | $447,000 | $311,000 |
| 2017 | $2,468 | $825,200 | $422,800 | $402,400 |
| 2016 | $2,302 | $777,700 | $422,800 | $354,900 |
| 2015 | $1,851 | $648,800 | $401,700 | $247,100 |
| 2014 | $1,673 | $725,700 | $363,600 | $362,100 |
Source: Public Records
Map
Nearby Homes
- 45-523 Halekou Rd Unit B
- 45-625 Halekou Rd
- 45-409 Mokulele Dr Unit 22
- 45-407 Mokulele Dr Unit 60
- 45-519 Kamehameha Hwy
- 45-433 Akimala St
- 45-513 Duncan Dr
- 45-535 Luluku Rd Unit J5
- 45-535 Luluku Rd Unit K2
- 45-535 Luluku Rd Unit K4
- 45-535 Luluku Rd Unit A53
- 45-535 Luluku Rd Unit A23
- 45-535 Luluku Rd Unit G2
- 45-340 Lehuuila St
- 45-456 Ihilani St
- 45-532 Kapalai Rd
- 45-816 Kupohu St
- 1 Kamehameha Hwy
- 45-731 Puupele St
- 45-20 Namoku St
- 45-529 Halekou Rd Unit 3A
- 45-375 Kanaka St
- 45-533 Halekou Rd
- 45-534 Halekou Rd
- 45-534 Halekou Rd Unit A
- 45-531A Halekou Rd
- 45-533 Halekou Rd Unit B
- 45-367 Kanaka St Unit 2204
- 45-379 Kanaka St
- 45-523 Halekou Rd
- 45-526 Halekou Rd
- 45-530 Halekou Rd
- 45-531 Halekou Rd Unit B
- 45-532 Halekou Rd
- 45-532 Halekou Rd Unit B-1
- 45-372 Kanaka St
- 45-361 Kanaka St
- 45-383 Kanaka St
- 45-370 Halenani Place
- 45-521 Halekou Rd