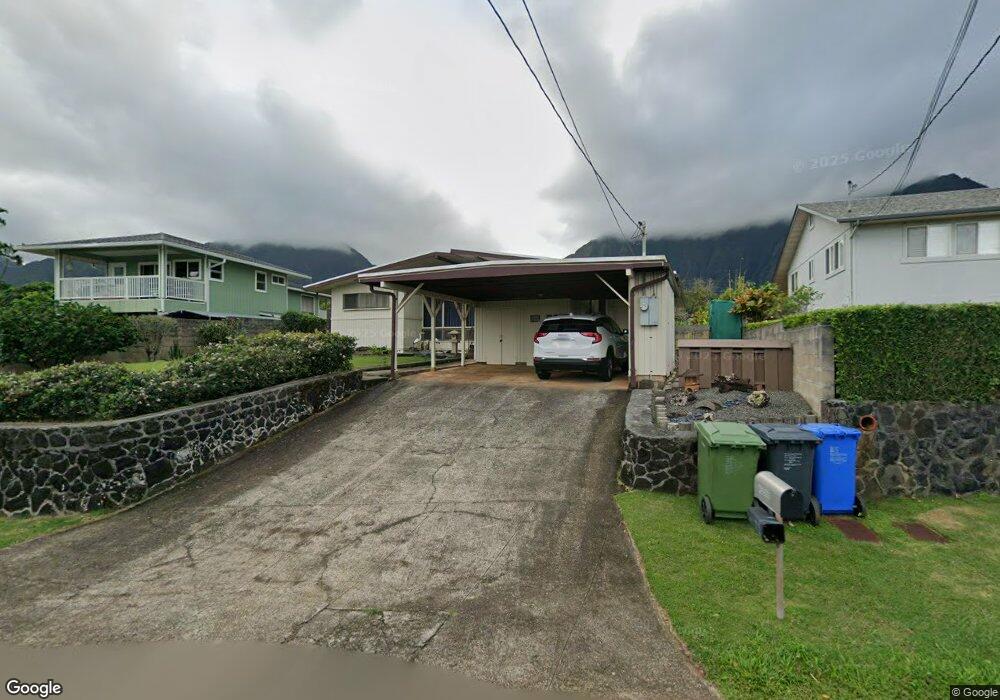
45-566 Duncan Dr Kaneohe, HI 96744
Estimated Value: $1,060,000 - $1,150,000
3
Beds
2
Baths
1,388
Sq Ft
$801/Sq Ft
Est. Value
About This Home
This home is located at 45-566 Duncan Dr, Kaneohe, HI 96744 and is currently estimated at $1,111,189, approximately $800 per square foot. 45-566 Duncan Dr is a home located in Honolulu County with nearby schools including Kaneohe Elementary School, Governor Samuel Wilder King Intermediate School, and Castle High School.
Ownership History
Date
Name
Owned For
Owner Type
Purchase Details
Closed on
Apr 10, 2024
Sold by
Lily Hong Hoon Wong Oto Trust and Oto Rodney Masao
Bought by
Oto Rodney Masao and Oto Linda Duncan
Current Estimated Value
Purchase Details
Closed on
Oct 10, 2019
Sold by
Wong Oto Lily Hong Hoon
Bought by
Wong Oto Lily Hong Hoon and Oto Rodney Masao
Purchase Details
Closed on
Sep 27, 2013
Sold by
Oto Henry Mamoru and Henry Mamoru Oto Trust
Bought by
Oto Henry Mamoru and Oto Lily Hong Hoon Wong
Purchase Details
Closed on
Nov 13, 2000
Sold by
Oto Henry Mamoru and Oto Lily Hong Hoon Wong
Bought by
Oto Henry Mamoru and Henry Mamoru Oto Trust
Purchase Details
Closed on
May 21, 1996
Sold by
Oto Henry Mamoru and Oto Lily Hong Hoon Wong
Bought by
Oto Henry Mamoru and Oto Lily Hong Hoon Wong
Create a Home Valuation Report for This Property
The Home Valuation Report is an in-depth analysis detailing your home's value as well as a comparison with similar homes in the area
Home Values in the Area
Average Home Value in this Area
Purchase History
| Date | Buyer | Sale Price | Title Company |
|---|---|---|---|
| Oto Rodney Masao | -- | None Listed On Document | |
| Wong Oto Lily Hong Hoon | -- | None Available | |
| Wong Oto Lily Hong Hoon | -- | None Available | |
| Wong Oto Lily Hong Hoon | -- | None Available | |
| Oto Henry Mamoru | -- | None Available | |
| Oto Henry Mamoru | -- | None Available | |
| Oto Henry Mamoru | -- | -- | |
| Oto Henry Mamoru | -- | -- |
Source: Public Records
Tax History Compared to Growth
Tax History
| Year | Tax Paid | Tax Assessment Tax Assessment Total Assessment is a certain percentage of the fair market value that is determined by local assessors to be the total taxable value of land and additions on the property. | Land | Improvement |
|---|---|---|---|---|
| 2025 | $3,461 | $1,069,100 | $926,500 | $142,600 |
| 2024 | $3,461 | $988,800 | $858,200 | $130,600 |
| 2023 | $1,821 | $1,027,900 | $858,200 | $169,700 |
| 2022 | $1,525 | $805,400 | $760,700 | $44,700 |
| 2021 | $2,185 | $764,300 | $672,900 | $91,400 |
| 2020 | $2,763 | $789,500 | $692,400 | $97,100 |
| 2019 | $2,197 | $757,600 | $656,700 | $100,900 |
| 2018 | $2,197 | $747,600 | $633,900 | $113,700 |
| 2017 | $2,025 | $698,500 | $536,400 | $162,100 |
| 2016 | $1,906 | $664,500 | $536,400 | $128,100 |
| 2015 | $1,827 | $641,900 | $536,400 | $105,500 |
| 2014 | -- | $672,300 | $516,000 | $156,300 |
Source: Public Records
Map
Nearby Homes
- 45-513 Duncan Dr
- 45-433 Akimala St
- 45-519 Kamehameha Hwy
- 45-409 Mokulele Dr Unit 22
- 45-407 Mokulele Dr Unit 60
- 45-456 Ihilani St
- 45-535 Luluku Rd Unit J5
- 45-535 Luluku Rd Unit K2
- 45-535 Luluku Rd Unit K4
- 45-535 Luluku Rd Unit A53
- 45-535 Luluku Rd Unit A23
- 45-535 Luluku Rd Unit G2
- 45-532 Kapalai Rd
- 1 Kamehameha Hwy
- 45-340 Lehuuila St
- 45-756 Kamehameha Hwy
- 45-625 Halekou Rd
- 45-523 Halekou Rd Unit B
- 45-20 Namoku St
- 45-860 Anoi Rd Unit 11
- 45-556 Duncan Dr
- 45-570 Duncan Dr
- 45-580 Duncan Dr
- 45-544 Duncan Dr
- 45-548 Duncan Dr
- 45-563 Duncan Dr
- 45-567 Duncan Dr
- 45-584 Duncan Dr
- 45-540 Duncan Dr
- 45-559 Duncan Dr Unit A
- 45-559 Duncan Dr
- 45-569 Duncan Dr
- 45-588 Duncan Dr
- 45-536 Duncan Dr
- 45-573 Duncan Dr
- 45-575 Duncan Dr
- 45-555 Duncan Dr
- 45-579 Duncan Dr
- 45-350 Koa Kahiko St
- 45-346 Koa Kahiko St