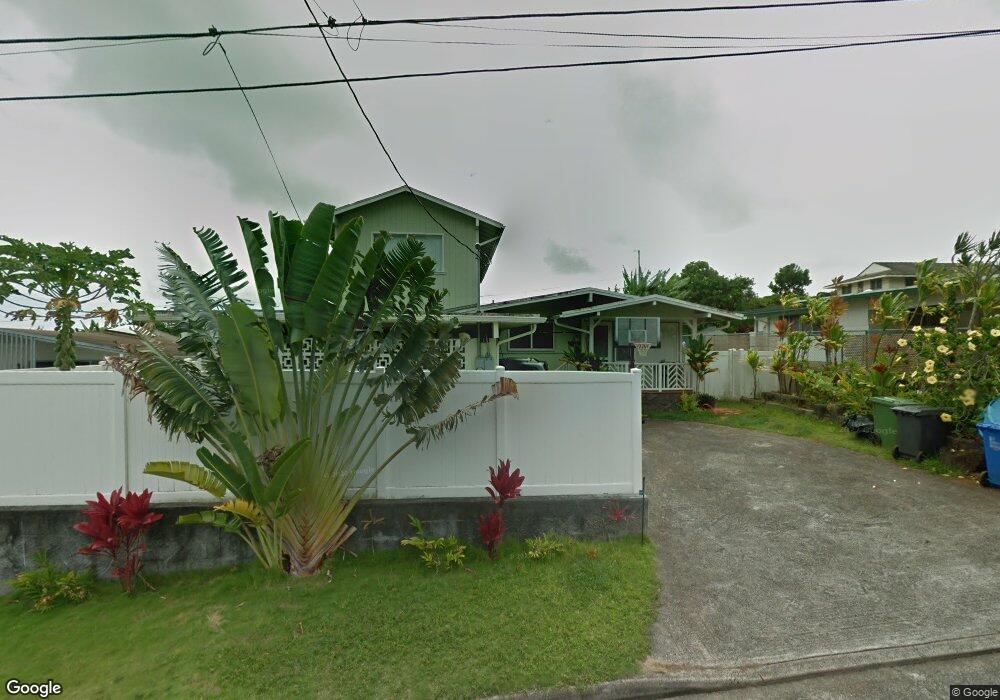
45-619 Nawahine Loop Kaneohe, HI 96744
Estimated Value: $1,210,000 - $1,513,000
5
Beds
3
Baths
2,508
Sq Ft
$518/Sq Ft
Est. Value
About This Home
This home is located at 45-619 Nawahine Loop, Kaneohe, HI 96744 and is currently estimated at $1,298,773, approximately $517 per square foot. 45-619 Nawahine Loop is a home located in Honolulu County with nearby schools including Kaneohe Elementary School, Governor Samuel Wilder King Intermediate School, and Castle High School.
Ownership History
Date
Name
Owned For
Owner Type
Purchase Details
Closed on
Apr 29, 2004
Sold by
Kiyomo Mildred S and Haggerty Sean D
Bought by
Haggerty Sean D and Haggerty Natalie K
Current Estimated Value
Home Financials for this Owner
Home Financials are based on the most recent Mortgage that was taken out on this home.
Original Mortgage
$310,000
Interest Rate
5.38%
Mortgage Type
Stand Alone Refi Refinance Of Original Loan
Purchase Details
Closed on
Jul 25, 1997
Sold by
Kiyono Harry K and Kiyono Mildred S
Bought by
Kiyono Mildred S and Haggerty Sean D
Home Financials for this Owner
Home Financials are based on the most recent Mortgage that was taken out on this home.
Original Mortgage
$233,750
Interest Rate
7.58%
Create a Home Valuation Report for This Property
The Home Valuation Report is an in-depth analysis detailing your home's value as well as a comparison with similar homes in the area
Home Values in the Area
Average Home Value in this Area
Purchase History
| Date | Buyer | Sale Price | Title Company |
|---|---|---|---|
| Haggerty Sean D | -- | -- | |
| Kiyono Mildred S | -- | -- |
Source: Public Records
Mortgage History
| Date | Status | Borrower | Loan Amount |
|---|---|---|---|
| Closed | Haggerty Sean D | $310,000 | |
| Closed | Kiyono Mildred S | $233,750 |
Source: Public Records
Tax History Compared to Growth
Tax History
| Year | Tax Paid | Tax Assessment Tax Assessment Total Assessment is a certain percentage of the fair market value that is determined by local assessors to be the total taxable value of land and additions on the property. | Land | Improvement |
|---|---|---|---|---|
| 2025 | $3,619 | $1,216,500 | $840,000 | $376,500 |
| 2024 | $3,619 | $1,154,100 | $787,500 | $366,600 |
| 2023 | $3,527 | $1,207,600 | $787,500 | $420,100 |
| 2022 | $3,464 | $1,089,600 | $724,500 | $365,100 |
| 2021 | $3,037 | $967,700 | $666,800 | $300,900 |
| 2020 | $3,085 | $981,400 | $656,300 | $325,100 |
| 2019 | $3,004 | $938,200 | $660,000 | $278,200 |
| 2018 | $2,870 | $900,000 | $621,500 | $278,500 |
| 2017 | $2,814 | $883,900 | $525,000 | $358,900 |
| 2016 | $2,794 | $878,300 | $525,000 | $353,300 |
| 2015 | $2,420 | $771,300 | $498,800 | $272,500 |
| 2014 | -- | $789,700 | $451,500 | $338,200 |
Source: Public Records
Map
Nearby Homes
- 45-625 Halekou Rd
- 45-553 Kuuipo Place Unit C
- 45-519 Kamehameha Hwy
- 45-513 Duncan Dr
- 45-433 Akimala St
- 45-407 Mokulele Dr Unit 60
- 45-535 Luluku Rd Unit K4
- 45-535 Luluku Rd Unit K2
- 45-535 Luluku Rd Unit G2
- 45-535 Luluku Rd Unit J5
- 45-535 Luluku Rd Unit G5
- 45-464 Nakuluai St
- 45-456 Ihilani St
- 45-340 Lehuuila St
- 1 Kamehameha Hwy
- 45-245 Iole St
- 45-756 Kamehameha Hwy
- 45-860 Anoi Rd Unit 5
- 45-554 Keneke Place
- 45-20 Namoku St
- 45-617 Nawahine Loop
- 45-623 Nawahine Loop
- 45-660 Halekou Rd
- 45-662 Halekou Rd
- 45-627 Nawahine Loop
- 45-613 Nawahine Loop Unit 206
- 45-658 Halekou Rd
- 45-618 Nawahine Loop
- 45-620 Nawahine Loop
- 45-666 Halekou Rd
- 45-654 Halekou Rd
- 45-626 Nawahine Loop
- 45-611 Nawahine Loop
- 45-615 Apuakea St
- 45-629 Nawahine Loop
- 45-668 Halekou Rd
- 45-619 Apuakea St
- 45-630 Nawahine Loop
- 45-623 Apuakea Place
- 45-621 Apuakea Place