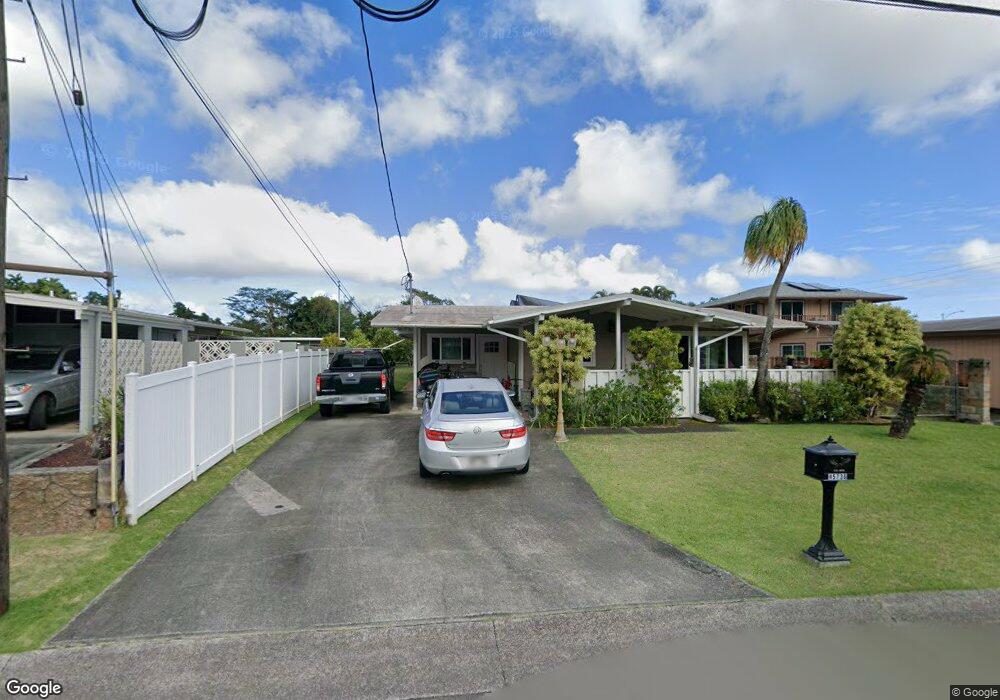
45-736 Hinamoe Loop Kaneohe, HI 96744
Estimated Value: $1,086,000 - $1,226,000
2
Beds
3
Baths
1,529
Sq Ft
$773/Sq Ft
Est. Value
About This Home
This home is located at 45-736 Hinamoe Loop, Kaneohe, HI 96744 and is currently estimated at $1,181,681, approximately $772 per square foot. 45-736 Hinamoe Loop is a home located in Honolulu County with nearby schools including Kapunahala Elementary School, Governor Samuel Wilder King Intermediate School, and Castle High School.
Ownership History
Date
Name
Owned For
Owner Type
Purchase Details
Closed on
Mar 7, 2006
Sold by
Fisher Melvin Wesley and Fisher Pok Im
Bought by
Baker Gina Grace Bell and Bell Rosita Vallar
Current Estimated Value
Home Financials for this Owner
Home Financials are based on the most recent Mortgage that was taken out on this home.
Original Mortgage
$400,000
Outstanding Balance
$224,860
Interest Rate
6.08%
Mortgage Type
Fannie Mae Freddie Mac
Estimated Equity
$956,821
Purchase Details
Closed on
May 22, 2000
Sold by
Baldwin John Castle and Mcintosh James Castle
Bought by
Fisher Melvin Wesley and Fisher Pok Im
Create a Home Valuation Report for This Property
The Home Valuation Report is an in-depth analysis detailing your home's value as well as a comparison with similar homes in the area
Home Values in the Area
Average Home Value in this Area
Purchase History
| Date | Buyer | Sale Price | Title Company |
|---|---|---|---|
| Baker Gina Grace Bell | $651,000 | Fhtc | |
| Fisher Melvin Wesley | -- | -- |
Source: Public Records
Mortgage History
| Date | Status | Borrower | Loan Amount |
|---|---|---|---|
| Open | Baker Gina Grace Bell | $400,000 |
Source: Public Records
Tax History Compared to Growth
Tax History
| Year | Tax Paid | Tax Assessment Tax Assessment Total Assessment is a certain percentage of the fair market value that is determined by local assessors to be the total taxable value of land and additions on the property. | Land | Improvement |
|---|---|---|---|---|
| 2025 | $3,297 | $1,204,800 | $914,100 | $290,700 |
| 2024 | $3,297 | $1,061,900 | $855,100 | $206,800 |
| 2023 | $3,245 | $1,127,200 | $855,100 | $272,100 |
| 2022 | $3,156 | $1,001,800 | $784,300 | $217,500 |
| 2021 | $2,840 | $911,400 | $725,400 | $186,000 |
| 2020 | $3,006 | $958,900 | $760,800 | $198,100 |
| 2019 | $3,076 | $958,900 | $737,200 | $221,700 |
| 2018 | $2,832 | $889,000 | $707,700 | $181,300 |
| 2017 | $2,680 | $845,800 | $589,700 | $256,100 |
| 2016 | $2,409 | $768,400 | $589,700 | $178,700 |
| 2015 | $2,027 | $659,000 | $560,200 | $98,800 |
| 2014 | -- | $653,300 | $501,300 | $152,000 |
Source: Public Records
Map
Nearby Homes
- 45-535 Luluku Rd Unit K4
- 45-535 Luluku Rd Unit K2
- 45-535 Luluku Rd Unit G2
- 45-535 Luluku Rd Unit J5
- 45-535 Luluku Rd Unit G5
- 1 Kamehameha Hwy
- 45-860 Anoi Rd Unit 5
- 45-860 Anoi Rd Unit 9
- 45-456 Ihilani St
- 45-756 Kamehameha Hwy
- 45-554 Keneke Place
- 45-553 Kuuipo Place Unit C
- 45-513 Duncan Dr
- 45-519 Kamehameha Hwy
- 45-588 Keaahala Rd
- 45-433 Akimala St
- 45-557 Keaahala Rd Unit K
- 45-1016 Pahuwai Place
- 45-1050 Anoi Rd Unit 2
- 46-270 Kahuhipa St Unit A619
- 45-738 Hinamoe Loop
- 45-732 Hinamoe Loop
- 45-728 Hinamoe Loop
- 45-682 Anoi Rd
- 45-680 Anoi Rd
- 45-733 Hinamoe Loop
- 45-731 Hinamoe Loop
- 45-726 Hinamoe Loop
- 45-672 Anoi Rd
- 45-666 Anoi Rd
- 45-724 Hinamoe Loop
- 45-621 Hinamoe Place Unit 28C
- 45-624 Hinamoe Place
- 45-673 Keneke St
- 45-675 Keneke St
- 45-679 Keneke St
- 45-664 Anoi Rd
- 45-681 Anoi Rd
- 45-671 Keneke St
- 45-587 Aneko Place