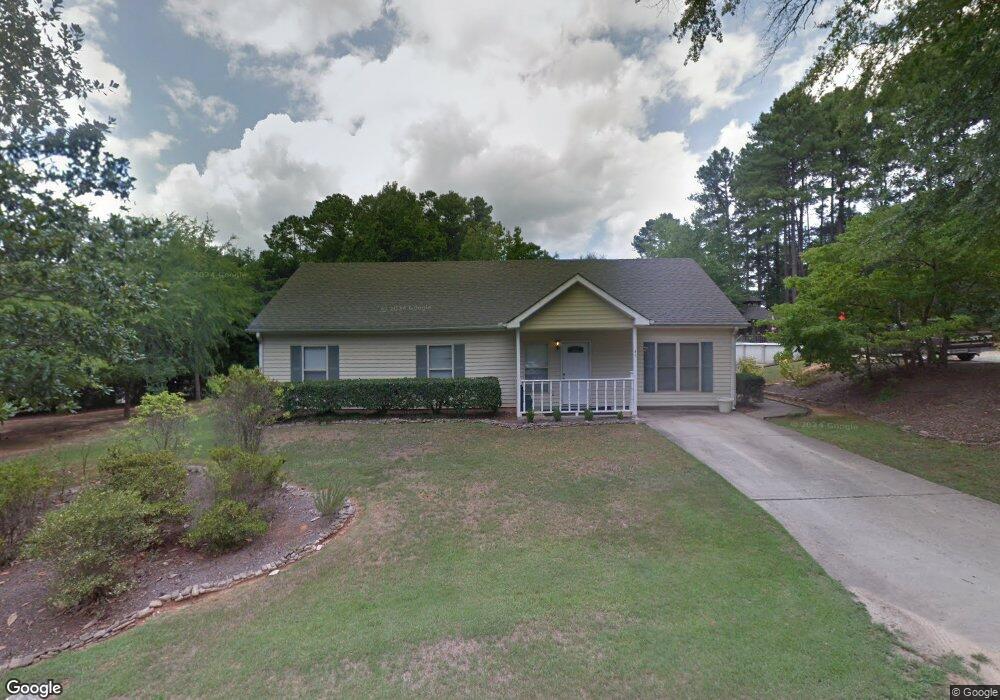
45 Andrew Rd Covington, GA 30016
Estimated Value: $219,000 - $261,000
Studio
2
Baths
1,120
Sq Ft
$216/Sq Ft
Est. Value
About This Home
This home is located at 45 Andrew Rd, Covington, GA 30016 and is currently estimated at $241,808, approximately $215 per square foot. 45 Andrew Rd is a home located in Newton County with nearby schools including Heard-Mixon Elementary School, Liberty Middle School, and Alcovy High School.
Ownership History
Date
Name
Owned For
Owner Type
Purchase Details
Closed on
Sep 6, 2024
Sold by
Henderson Frances J
Bought by
Henderson David A
Current Estimated Value
Purchase Details
Closed on
Mar 15, 2022
Sold by
Thompson Timothy J
Bought by
Thompson Timothy J and Shields Justine
Purchase Details
Closed on
Sep 20, 2012
Sold by
Thompson Julie Leight
Bought by
Thompson Timothy John
Purchase Details
Closed on
Feb 24, 1998
Sold by
Humphrey Susan D
Bought by
Dodson Julie I
Home Financials for this Owner
Home Financials are based on the most recent Mortgage that was taken out on this home.
Original Mortgage
$75,091
Interest Rate
6.95%
Mortgage Type
FHA
Purchase Details
Closed on
May 16, 1996
Sold by
Johnson Philip
Bought by
Johnson Michael Stacey
Create a Home Valuation Report for This Property
The Home Valuation Report is an in-depth analysis detailing your home's value as well as a comparison with similar homes in the area
Home Values in the Area
Average Home Value in this Area
Purchase History
| Date | Buyer | Sale Price | Title Company |
|---|---|---|---|
| Henderson David A | $1,000,000 | -- | |
| Thompson Timothy J | -- | -- | |
| Thompson Timothy John | -- | -- | |
| Dodson Julie I | $76,000 | -- | |
| Johnson Michael Stacey | $72,000 | -- |
Source: Public Records
Mortgage History
| Date | Status | Borrower | Loan Amount |
|---|---|---|---|
| Previous Owner | Dodson Julie I | $75,091 |
Source: Public Records
Tax History
| Year | Tax Paid | Tax Assessment Tax Assessment Total Assessment is a certain percentage of the fair market value that is determined by local assessors to be the total taxable value of land and additions on the property. | Land | Improvement |
|---|---|---|---|---|
| 2025 | $1,858 | $81,560 | $16,760 | $64,800 |
| 2024 | $1,737 | $72,440 | $9,520 | $62,920 |
| 2023 | $1,786 | $69,680 | $9,520 | $60,160 |
| 2022 | $1,355 | $53,800 | $9,520 | $44,280 |
| 2021 | $1,235 | $44,600 | $9,520 | $35,080 |
| 2020 | $1,061 | $35,480 | $9,000 | $26,480 |
| 2019 | $1,073 | $35,360 | $9,000 | $26,360 |
| 2018 | $1,109 | $36,200 | $9,000 | $27,200 |
| 2017 | $881 | $29,560 | $5,000 | $24,560 |
| 2016 | $847 | $28,560 | $4,000 | $24,560 |
| 2015 | $663 | $23,200 | $4,000 | $19,200 |
| 2014 | $620 | $21,960 | $0 | $0 |
Source: Public Records
Map
Nearby Homes
- 219 Channing Cope Rd
- 440 Varner St
- 550 Anderson Creek Rd
- 0 White Laurel Ln Unit 16
- 12510 Highway 36
- 0 River Shoals Ct Unit 10620666
- 60 Laurie Ln
- 230 Alcovy Reserve Way
- 90 Alcovy Reserve Way
- 70 Alcovy Reserve Way
- 12895 Highway 36
- 170 Hidden Pines Dr
- 674 Lower River Rd
- 0 Highway 36 Unit 10671092
- 0 Highway 36 Unit 10632443
- 0 Rocky Plains Rd Unit 18248418
- 185 Mountain View Cir
- 915 Navajo Trail
- 10717 Highway 36
- 50 Stacia Dr
- 168 Andrew Rd
- 25 Andrew Rd
- 20 Andrew Rd
- 87 Andrew Rd
- 12086 Flat Shoals Rd
- 38 Andrew Rd
- 35 Moss Rd
- 20 Moss Rd
- 66 Channing Cope Rd
- 12095 Flat Shoals Rd
- 76 Channing Cope Rd
- 81 Andrew Rd
- 38 Channing Cope Rd
- 85 Andrew Rd
- 43 Moss Rd
- 96 Channing Cope Rd
- 12044 Flat Shoals Rd
- 140 Andrew Rd
- 0 Andrew Rd Unit 7331670
- 40 Moss Rd
Your Personal Tour Guide
Ask me questions while you tour the home.