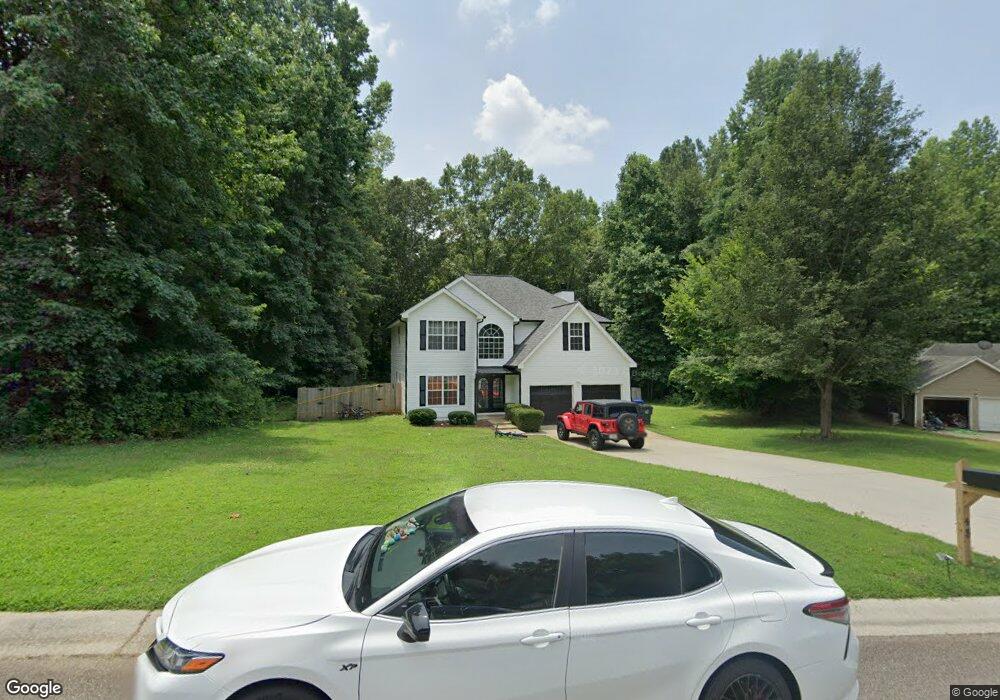
45 Andrews Ct Jefferson, GA 30549
Estimated Value: $318,000 - $393,000
4
Beds
3
Baths
2,255
Sq Ft
$161/Sq Ft
Est. Value
About This Home
This home is located at 45 Andrews Ct, Jefferson, GA 30549 and is currently estimated at $362,360, approximately $160 per square foot. 45 Andrews Ct is a home located in Jackson County with nearby schools including Jefferson Elementary School, Jefferson Academy, and Jefferson Middle School.
Ownership History
Date
Name
Owned For
Owner Type
Purchase Details
Closed on
Oct 11, 2019
Sold by
Mitchell Ormond
Bought by
Seigler Brandy L
Current Estimated Value
Home Financials for this Owner
Home Financials are based on the most recent Mortgage that was taken out on this home.
Original Mortgage
$201,286
Outstanding Balance
$175,325
Interest Rate
3.75%
Mortgage Type
FHA
Estimated Equity
$187,035
Purchase Details
Closed on
Sep 28, 2011
Sold by
Deutsche Bank National
Bought by
Mitchell Ormand Sanders
Home Financials for this Owner
Home Financials are based on the most recent Mortgage that was taken out on this home.
Original Mortgage
$74,725
Interest Rate
4.26%
Mortgage Type
New Conventional
Purchase Details
Closed on
May 3, 2011
Sold by
Cash Teresa
Bought by
Deutsche Bank National
Purchase Details
Closed on
Aug 16, 2005
Sold by
Sierra Residential Propert
Bought by
Cash Teresa
Purchase Details
Closed on
Aug 22, 2002
Sold by
Sunlight Residential Inc
Bought by
Sierra Residential Properties Inc
Purchase Details
Closed on
Nov 23, 2001
Sold by
Wishbone Partners
Bought by
Sunlight Residential Inc
Create a Home Valuation Report for This Property
The Home Valuation Report is an in-depth analysis detailing your home's value as well as a comparison with similar homes in the area
Home Values in the Area
Average Home Value in this Area
Purchase History
| Date | Buyer | Sale Price | Title Company |
|---|---|---|---|
| Seigler Brandy L | $205,000 | -- | |
| Mitchell Ormand Sanders | $72,199 | -- | |
| Deutsche Bank National | $125,000 | -- | |
| Cash Teresa | $146,900 | -- | |
| Sierra Residential Properties Inc | -- | -- | |
| Sunlight Residential Inc | $1,568,000 | -- |
Source: Public Records
Mortgage History
| Date | Status | Borrower | Loan Amount |
|---|---|---|---|
| Open | Seigler Brandy L | $201,286 | |
| Previous Owner | Deutsche Bank National | $74,725 |
Source: Public Records
Tax History
| Year | Tax Paid | Tax Assessment Tax Assessment Total Assessment is a certain percentage of the fair market value that is determined by local assessors to be the total taxable value of land and additions on the property. | Land | Improvement |
|---|---|---|---|---|
| 2025 | $3,037 | $111,120 | $23,200 | $87,920 |
| 2024 | $3,037 | $111,120 | $23,200 | $87,920 |
| 2023 | $3,049 | $99,440 | $23,200 | $76,240 |
| 2022 | $2,743 | $85,320 | $23,200 | $62,120 |
| 2021 | $2,392 | $73,080 | $10,960 | $62,120 |
| 2020 | $2,176 | $62,120 | $10,960 | $51,160 |
| 2019 | $2,107 | $59,840 | $10,960 | $48,880 |
| 2018 | $2,038 | $57,480 | $10,960 | $46,520 |
| 2017 | $2,017 | $55,738 | $10,960 | $44,778 |
| 2016 | $2,026 | $55,738 | $10,960 | $44,778 |
| 2015 | $1,777 | $48,778 | $4,000 | $44,778 |
| 2014 | $1,615 | $43,964 | $4,000 | $39,964 |
| 2013 | -- | $37,747 | $4,000 | $33,747 |
Source: Public Records
Map
Nearby Homes
- 175 Paxton Ln
- 594 Paxton Ln
- 354 Paxton Ln
- 461 Paxton Ln
- 250 Bryce Ave
- 175 Thornberry Ln
- 326 Briarcrest Dr
- 520 Virginia Ave
- 420 Andrew Ridge Dr
- 58 Thornberry Ln
- 38 Jameston Dr
- 104 Jameston Dr
- 131 Wood Cove
- 241 Jameston Dr Unit 20
- 241 Jameston Dr
- 581 Rachel View Ct
- 748 Sandstone Trail
- 332 Jameston Dr
- 332 Jameston Dr Unit 28
- 690 Lake Vista Dr
- 57 Andrews Ct
- 286 Hamilton Dr
- 28 Andrews Ct
- 58 Andrews Ct
- 48 Andrews Ct
- 241 Hamilton Dr
- 279 Hamilton Dr
- 279 Hamilton Dr Unit 13
- 210 Hamilton Dr
- E Hamilton Dr
- 219 Hamilton Dr
- 305 Hamilton Dr
- 82 Aberdeen Ct
- 93 Aberdeen Ct
- 60 Aberdeen Ct
- 36 Aberdeen Ct
- 327 Hamilton Dr
- 108 Aberdeen Ct
- 188 Hamilton Dr
- 349 Hamilton Dr
Your Personal Tour Guide
Ask me questions while you tour the home.