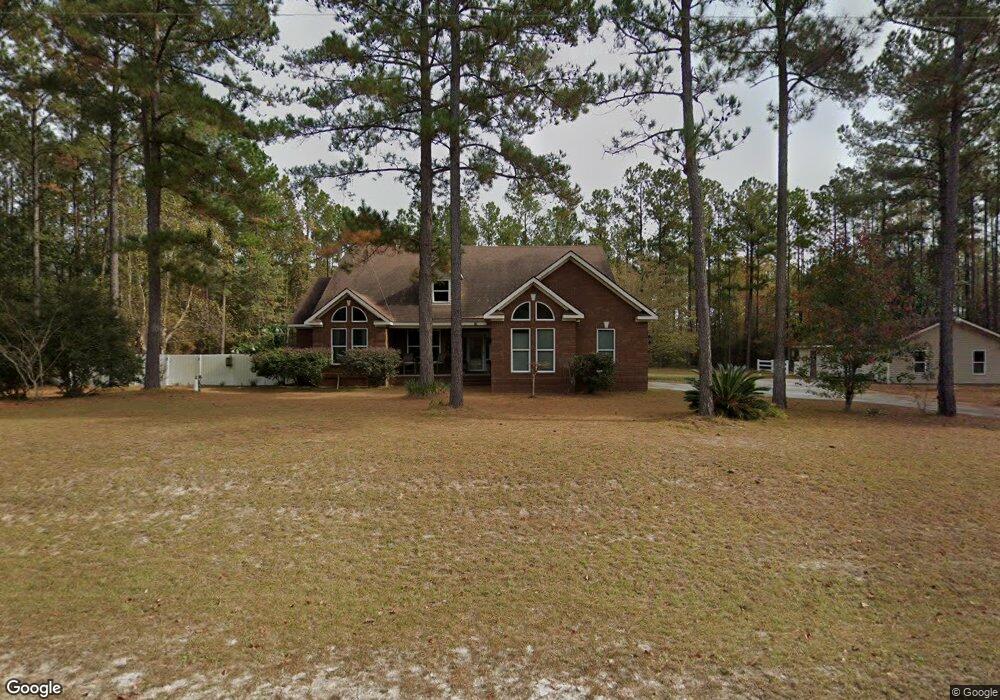
45 Aspen Ln Ellabell, GA 31308
Estimated Value: $408,144 - $452,000
3
Beds
3
Baths
2,475
Sq Ft
$173/Sq Ft
Est. Value
About This Home
This home is located at 45 Aspen Ln, Ellabell, GA 31308 and is currently estimated at $428,536, approximately $173 per square foot. 45 Aspen Ln is a home located in Bryan County with nearby schools including Lanier Primary School, Bryan County Elementary School, and Bryan County Middle School.
Ownership History
Date
Name
Owned For
Owner Type
Purchase Details
Closed on
Aug 26, 2016
Sold by
Tomlinson James D and Tomlinson Barbara
Bought by
Bray Jackson Dean
Current Estimated Value
Home Financials for this Owner
Home Financials are based on the most recent Mortgage that was taken out on this home.
Original Mortgage
$255,290
Outstanding Balance
$203,522
Interest Rate
3.37%
Mortgage Type
FHA
Estimated Equity
$225,014
Purchase Details
Closed on
Jan 15, 2010
Sold by
Davis Jimmy W
Bought by
Tomlinson James D and Tomlinson Barbara
Purchase Details
Closed on
Aug 15, 2005
Sold by
Polk Michael B
Bought by
Davis Jimmy W and Davis Janis M
Purchase Details
Closed on
Jan 26, 2005
Sold by
Polk April C
Bought by
Polk Michael B
Purchase Details
Closed on
Mar 24, 2004
Sold by
Dubose Carney Development
Bought by
Polk Michael B and Polk April C
Purchase Details
Closed on
Dec 4, 2003
Bought by
Dubose Carney Development
Create a Home Valuation Report for This Property
The Home Valuation Report is an in-depth analysis detailing your home's value as well as a comparison with similar homes in the area
Home Values in the Area
Average Home Value in this Area
Purchase History
| Date | Buyer | Sale Price | Title Company |
|---|---|---|---|
| Bray Jackson Dean | $260,000 | -- | |
| Tomlinson James D | $52,000 | -- | |
| Davis Jimmy W | $48,500 | -- | |
| Polk Michael B | -- | -- | |
| Polk Michael B | $35,000 | -- | |
| Dubose Carney Development | $154,400 | -- |
Source: Public Records
Mortgage History
| Date | Status | Borrower | Loan Amount |
|---|---|---|---|
| Open | Bray Jackson Dean | $255,290 |
Source: Public Records
Tax History Compared to Growth
Tax History
| Year | Tax Paid | Tax Assessment Tax Assessment Total Assessment is a certain percentage of the fair market value that is determined by local assessors to be the total taxable value of land and additions on the property. | Land | Improvement |
|---|---|---|---|---|
| 2024 | $3,918 | $154,480 | $14,800 | $139,680 |
| 2023 | $3,918 | $116,520 | $16,280 | $100,240 |
| 2022 | $2,903 | $104,480 | $14,800 | $89,680 |
| 2021 | $2,926 | $102,800 | $14,800 | $88,000 |
| 2020 | $2,539 | $102,000 | $14,000 | $88,000 |
| 2019 | $2,905 | $99,640 | $14,000 | $85,640 |
| 2018 | $2,860 | $99,640 | $14,000 | $85,640 |
| 2017 | $2,680 | $97,680 | $14,000 | $83,680 |
| 2016 | $2,603 | $93,480 | $14,000 | $79,480 |
| 2015 | $2,591 | $92,600 | $14,000 | $78,600 |
| 2014 | $2,309 | $93,400 | $14,000 | $79,400 |
Source: Public Records
Map
Nearby Homes
- 2391 Homestead Dr
- 32 Sheridan Ct
- 145 Worthington Dr
- 535 & 565 Deer Run Rd
- 29 Sterling Ct
- 58 Westhampton Dr
- 38 Westhampton Dr
- 1530 Olive Branch Rd
- 8303 Us Hwy 280
- 1560 Olive Branch Rd
- 0 Us 80 Hwy Unit 322296
- 1800 Olive Branch Rd
- 12010 Highway 280 E
- 0 Ga 204 Hwy Unit 328802
- 589 Old Mill Creek Rd
- 0 Pine Needle Dr Unit 281939
- 397 Pine Ridge Dr
- 725 Blue Gill Rd
- 1000 Pine Needle Dr
- 628 Toni Branch Rd
- 40 Aspen Ln
- 30 Aspen Ln
- 35 Aspen Ln
- 25 Aspen Ln
- 10 Aspen Ln
- 15 Aspen Ln
- 10198 Us Highway 280
- 432 Groover Hill Rd
- 210 Groover Hill Rd
- 182 Groover Hill Rd
- 84 Campfield St
- 9723 Us Highway 280
- 9723 Us Highway 280
- 303 Groover Hill Rd
- 35 Campfield St
- 245 Groover Hill Rd
- 391 Groover Hill Rd
- 9724 Us Highway 280
- 1921 Homestead Dr
- 1000 Groover Hill Rd