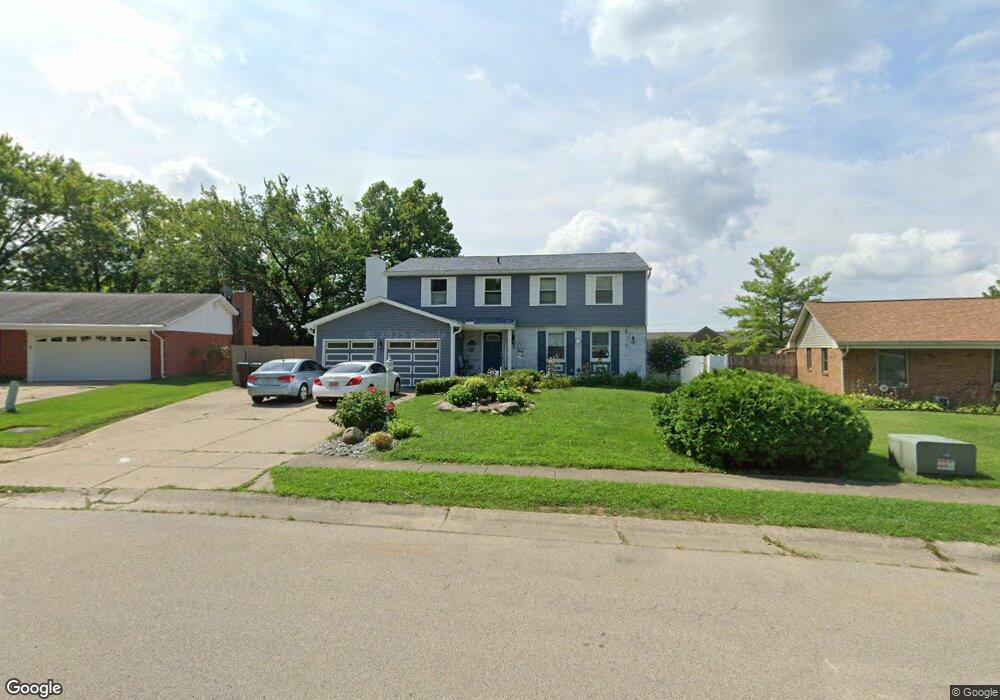
45 Bayberry Dr Springboro, OH 45066
Estimated Value: $351,000 - $370,000
4
Beds
3
Baths
1,912
Sq Ft
$189/Sq Ft
Est. Value
About This Home
This home is located at 45 Bayberry Dr, Springboro, OH 45066 and is currently estimated at $361,640, approximately $189 per square foot. 45 Bayberry Dr is a home located in Warren County with nearby schools including Clearcreek Elementary School, Springboro Intermediate School, and Dennis Elementary School.
Ownership History
Date
Name
Owned For
Owner Type
Purchase Details
Closed on
Feb 5, 2021
Sold by
Goode William R
Bought by
Becherer Kim and Kleinberg Jerald
Current Estimated Value
Home Financials for this Owner
Home Financials are based on the most recent Mortgage that was taken out on this home.
Original Mortgage
$189,625
Outstanding Balance
$154,579
Interest Rate
2.65%
Mortgage Type
New Conventional
Estimated Equity
$207,061
Purchase Details
Closed on
Apr 27, 2009
Sold by
Becherer James J and Becherer Carolyn L
Bought by
Becherer Kim and Goode William R
Home Financials for this Owner
Home Financials are based on the most recent Mortgage that was taken out on this home.
Original Mortgage
$135,327
Interest Rate
4.85%
Mortgage Type
FHA
Purchase Details
Closed on
May 29, 1987
Sold by
Forsberg Forsberg and Forsberg Wm.M.
Bought by
Becherer Becherer and Becherer James
Purchase Details
Closed on
Sep 28, 1978
Sold by
Tri Ohio Development Co
Purchase Details
Closed on
Mar 17, 1978
Sold by
Tri-Ohio Dev Co
Create a Home Valuation Report for This Property
The Home Valuation Report is an in-depth analysis detailing your home's value as well as a comparison with similar homes in the area
Home Values in the Area
Average Home Value in this Area
Purchase History
| Date | Buyer | Sale Price | Title Company |
|---|---|---|---|
| Becherer Kim | $96,867 | None Available | |
| Becherer Kim | $153,000 | Partners Land Title Agency | |
| Becherer Becherer | $106,900 | -- | |
| -- | $64,500 | -- | |
| -- | -- | -- |
Source: Public Records
Mortgage History
| Date | Status | Borrower | Loan Amount |
|---|---|---|---|
| Open | Becherer Kim | $189,625 | |
| Previous Owner | Becherer Kim | $135,327 |
Source: Public Records
Tax History Compared to Growth
Tax History
| Year | Tax Paid | Tax Assessment Tax Assessment Total Assessment is a certain percentage of the fair market value that is determined by local assessors to be the total taxable value of land and additions on the property. | Land | Improvement |
|---|---|---|---|---|
| 2024 | $3,878 | $99,300 | $24,500 | $74,800 |
| 2023 | $3,356 | $79,999 | $16,520 | $63,479 |
| 2022 | $3,356 | $80,000 | $16,520 | $63,480 |
| 2021 | $3,124 | $80,000 | $16,520 | $63,480 |
| 2020 | $3,028 | $67,795 | $14,000 | $53,795 |
| 2019 | $2,792 | $67,795 | $14,000 | $53,795 |
| 2018 | $2,794 | $67,795 | $14,000 | $53,795 |
| 2017 | $2,493 | $54,499 | $12,096 | $42,403 |
| 2016 | $2,600 | $54,499 | $12,096 | $42,403 |
| 2015 | $2,571 | $54,499 | $12,096 | $42,403 |
| 2014 | $2,571 | $50,930 | $11,310 | $39,630 |
| 2013 | $2,569 | $63,070 | $14,000 | $49,070 |
Source: Public Records
Map
Nearby Homes
- 120 Clearview Dr
- 145 Cedar Hill Ln
- The McPherson Plan at Wadestone - Designer Collection
- Winslow Plan at Wadestone - Masterpiece Collection
- Avery Plan at Wadestone - Designer Collection
- Emmett Plan at Wadestone - Designer Collection
- Rhodes Plan at Wadestone - Masterpiece Collection
- Carrington Plan at Wadestone - Designer Collection
- Winston Plan at Wadestone - Designer Collection
- Paxton Plan at Wadestone - Masterpiece Collection
- Calvin Plan at Wadestone - Designer Collection
- Magnolia Plan at Wadestone - Designer Collection
- Pearson Plan at Wadestone - Masterpiece Collection
- Blair Plan at Wadestone - Designer Collection
- Grandin Plan at Wadestone - Designer Collection
- Finley Plan at Wadestone - Masterpiece Collection
- Mitchell Plan at Wadestone - Masterpiece Collection
- Leland Plan at Wadestone - Masterpiece Collection
- Wyatt Plan at Wadestone - Designer Collection
- Huxley Plan at Wadestone - Masterpiece Collection
- 55 Bayberry Dr
- 35 Bayberry Dr
- 65 Bayberry Dr
- 25 Bayberry Dr
- 40 Bayberry Dr
- 60 Bayberry Dr
- 75 Bayberry Dr
- 20 Bayberry Dr
- 15 Bayberry Dr
- 70 Bayberry Dr
- 85 Bayberry Dr
- 15 Southridge Ct
- 70 Springwood Dr
- 80 Springwood Dr
- 40 Springwood Dr
- 95 Bayberry Dr
- 25 Southridge Ct
- 90 Springwood Dr
- 100 Bayberry Dr
- 105 Bayberry Dr