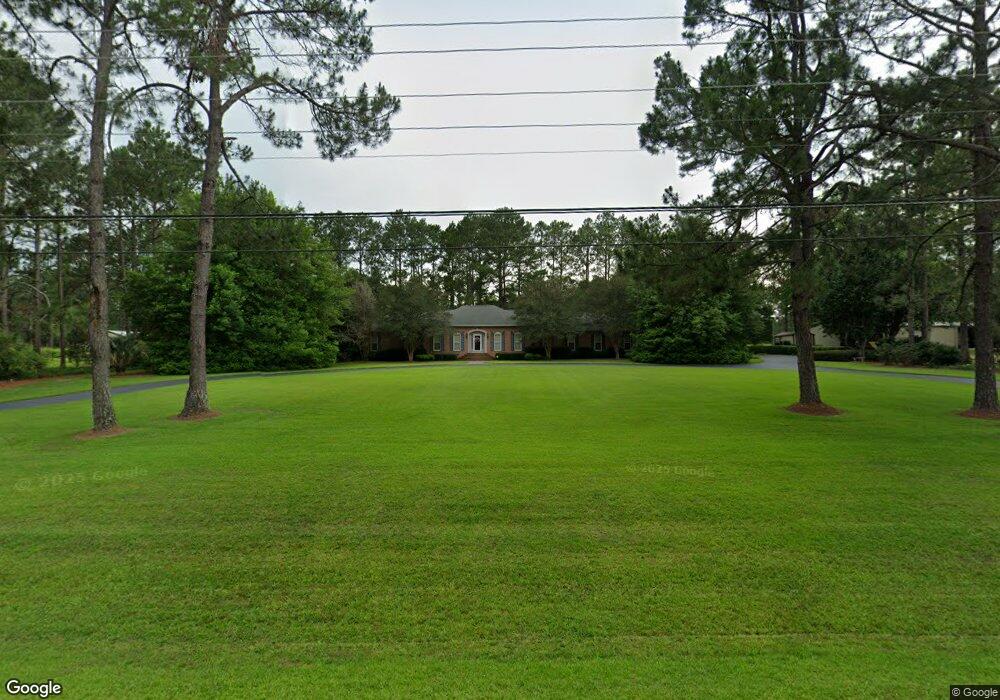
45 Belflower Rd Tifton, GA 31794
Estimated Value: $370,000 - $436,000
3
Beds
2
Baths
2,816
Sq Ft
$140/Sq Ft
Est. Value
About This Home
This home is located at 45 Belflower Rd, Tifton, GA 31794 and is currently estimated at $394,197, approximately $139 per square foot. 45 Belflower Rd is a home located in Tift County with nearby schools including Northside Primary School, Charles Spencer Elementary School, and J.T. Reddick School.
Ownership History
Date
Name
Owned For
Owner Type
Purchase Details
Closed on
May 14, 1986
Bought by
Searcy W G
Current Estimated Value
Create a Home Valuation Report for This Property
The Home Valuation Report is an in-depth analysis detailing your home's value as well as a comparison with similar homes in the area
Home Values in the Area
Average Home Value in this Area
Purchase History
| Date | Buyer | Sale Price | Title Company |
|---|---|---|---|
| Searcy W G | $19,000 | -- |
Source: Public Records
Tax History Compared to Growth
Tax History
| Year | Tax Paid | Tax Assessment Tax Assessment Total Assessment is a certain percentage of the fair market value that is determined by local assessors to be the total taxable value of land and additions on the property. | Land | Improvement |
|---|---|---|---|---|
| 2024 | $3,393 | $157,534 | $16,260 | $141,274 |
| 2023 | $3,687 | $95,236 | $15,600 | $79,636 |
| 2022 | $2,767 | $95,236 | $15,600 | $79,636 |
| 2021 | $2,784 | $95,236 | $15,600 | $79,636 |
| 2020 | $2,951 | $98,972 | $15,600 | $83,372 |
| 2019 | $2,944 | $98,972 | $15,600 | $83,372 |
| 2018 | $2,940 | $98,972 | $15,600 | $83,372 |
| 2017 | $2,954 | $98,972 | $15,600 | $83,372 |
| 2016 | $2,957 | $98,972 | $15,600 | $83,372 |
| 2015 | $2,953 | $98,972 | $15,600 | $83,372 |
| 2014 | $2,909 | $97,448 | $15,600 | $81,848 |
| 2013 | -- | $97,448 | $15,600 | $81,848 |
Source: Public Records
Map
Nearby Homes
- -0- Old Ocilla Rd
- 2612 Goff St
- 0 Belflower Rd Unit 25624433
- 0 Belflower Rd Unit 139026
- 0 Belflower Rd Unit 24022932
- 0 Belflower Rd Unit 138547
- 0 Belflower Rd Unit 10554704
- 0 Old Ocilla Rd Unit 138781
- 0 Old Ocilla Rd Unit 10611000
- 153 Belflower Rd
- 2417 Belmont Ave
- 903 42nd St E
- 2411 Davis Ave
- 2021 Davis Ave
- 2020 Davis Ave
- 0 44th St E
- 0 E 46th St
- 913 E 46th St
- 705 20th St E
- 717 E 44th St
- 0 (lot 2 Belflower
- 67 Belflower Rd
- 3604 Lullwater Rd
- 3007 Lullwater Rd
- 26 Belflower Rd
- 3011 Lullwater Rd
- 71 Belflower Rd
- 2811 Lullwater Rd
- 35 Tolliver Way
- 3605 Lullwater Rd
- 15 Belflower Rd
- 20 Belflower Rd
- 3601 Lullwater Rd
- 77 Belflower Rd
- 29 Tolliver Way
- 3409 Lullwater Rd
- 9 Belflower Rd
- 83 Belflower Rd
- 23 Tolliver Way
- 3200 Lullwater Rd