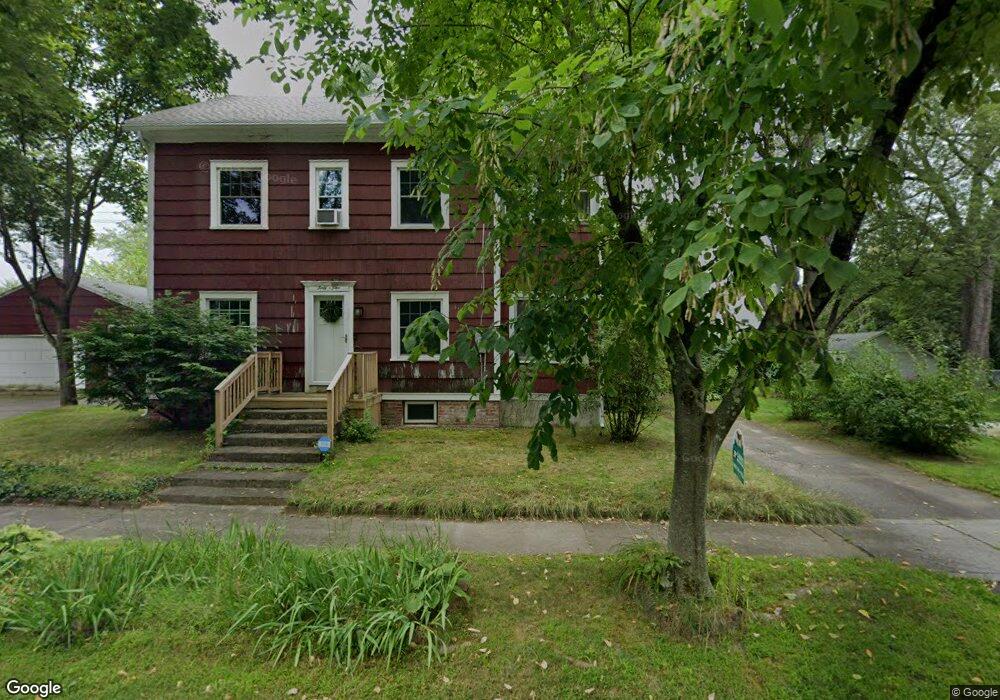
45 Bellevue Ave Longmeadow, MA 01106
Estimated Value: $315,000 - $397,000
3
Beds
3
Baths
1,439
Sq Ft
$252/Sq Ft
Est. Value
About This Home
This home is located at 45 Bellevue Ave, Longmeadow, MA 01106 and is currently estimated at $363,144, approximately $252 per square foot. 45 Bellevue Ave is a home located in Hampden County with nearby schools including Wolf Swamp Road School, Glenbrook Middle School, and Longmeadow High School.
Ownership History
Date
Name
Owned For
Owner Type
Purchase Details
Closed on
Nov 6, 2017
Sold by
Robitaille Michel E and Robitaille Andre D
Bought by
Robitaille Michel E
Current Estimated Value
Home Financials for this Owner
Home Financials are based on the most recent Mortgage that was taken out on this home.
Original Mortgage
$116,500
Outstanding Balance
$97,570
Interest Rate
3.83%
Mortgage Type
New Conventional
Estimated Equity
$265,574
Purchase Details
Closed on
May 17, 2013
Sold by
Es Robitaille Albert G
Bought by
Robitaille Michel E and Robitaille Andre D
Purchase Details
Closed on
May 14, 1987
Sold by
Robitaille Fannie R
Bought by
Robitaille Albert G
Home Financials for this Owner
Home Financials are based on the most recent Mortgage that was taken out on this home.
Original Mortgage
$22,400
Interest Rate
9.31%
Mortgage Type
Purchase Money Mortgage
Create a Home Valuation Report for This Property
The Home Valuation Report is an in-depth analysis detailing your home's value as well as a comparison with similar homes in the area
Home Values in the Area
Average Home Value in this Area
Purchase History
| Date | Buyer | Sale Price | Title Company |
|---|---|---|---|
| Robitaille Michel E | $111,000 | -- | |
| Robitaille Michel E | -- | -- | |
| Robitaille Albert G | $28,000 | -- |
Source: Public Records
Mortgage History
| Date | Status | Borrower | Loan Amount |
|---|---|---|---|
| Open | Robitaille Michel E | $116,500 | |
| Previous Owner | Robitaille Albert G | $68,500 | |
| Previous Owner | Robitaille Albert G | $22,400 |
Source: Public Records
Tax History
| Year | Tax Paid | Tax Assessment Tax Assessment Total Assessment is a certain percentage of the fair market value that is determined by local assessors to be the total taxable value of land and additions on the property. | Land | Improvement |
|---|---|---|---|---|
| 2025 | $6,408 | $303,400 | $145,000 | $158,400 |
| 2024 | $6,283 | $303,800 | $145,000 | $158,800 |
| 2023 | $5,863 | $255,800 | $116,800 | $139,000 |
| 2022 | $5,726 | $232,400 | $116,800 | $115,600 |
| 2021 | $5,720 | $231,200 | $118,100 | $113,100 |
| 2020 | $5,379 | $222,200 | $111,200 | $111,000 |
| 2019 | $5,389 | $223,700 | $111,200 | $112,500 |
| 2018 | $5,391 | $221,500 | $129,900 | $91,600 |
| 2017 | $5,223 | $221,500 | $129,900 | $91,600 |
| 2016 | $5,102 | $209,700 | $123,100 | $86,600 |
| 2015 | $4,925 | $208,500 | $121,900 | $86,600 |
Source: Public Records
Map
Nearby Homes
- 27 Booth St
- 27 Massachusetts Ave
- 11 Willard Ave
- 79 Roosevelt Blvd
- 1435 Longmeadow St
- 141 Lincoln Rd
- 50 Roosevelt Blvd
- 31 Sharren Ln
- 2 Sharren Ln
- 35 Bernardino Ave
- Lot 114 Bark Haul Rd
- 20 Manning Rd
- 41 Field Rd
- 0 Mill Rd
- 56 Liberty Ln
- 46 Liberty Ln
- 43 Liberty Ln
- 41 Liberty Ln
- 59 Liberty Ln
- 44 Liberty Ln
- 29 Bellevue Ave
- 47 Bellevue Ave
- 42 Elm Ave
- 42 Elm Ave Unit 1
- 42 Elm Ave Unit 42
- 5 Elm Ave
- 32 Elm Ave Unit 34
- 32 Elm Ave Unit 32
- 23 Bellevue Ave
- 23 Bellevue Ave
- 28 Bellevue Ave
- 50 Bellevue Ave
- 7 Elm Ave
- 56 Bellevue Ave
- 20 Elm Ave
- 33 Elm Meadows
- 33 Elm Meadows
- 0 Elm Ave
- 43 Elm Meadows
- 43 Elm Meadows Unit 43
Your Personal Tour Guide
Ask me questions while you tour the home.