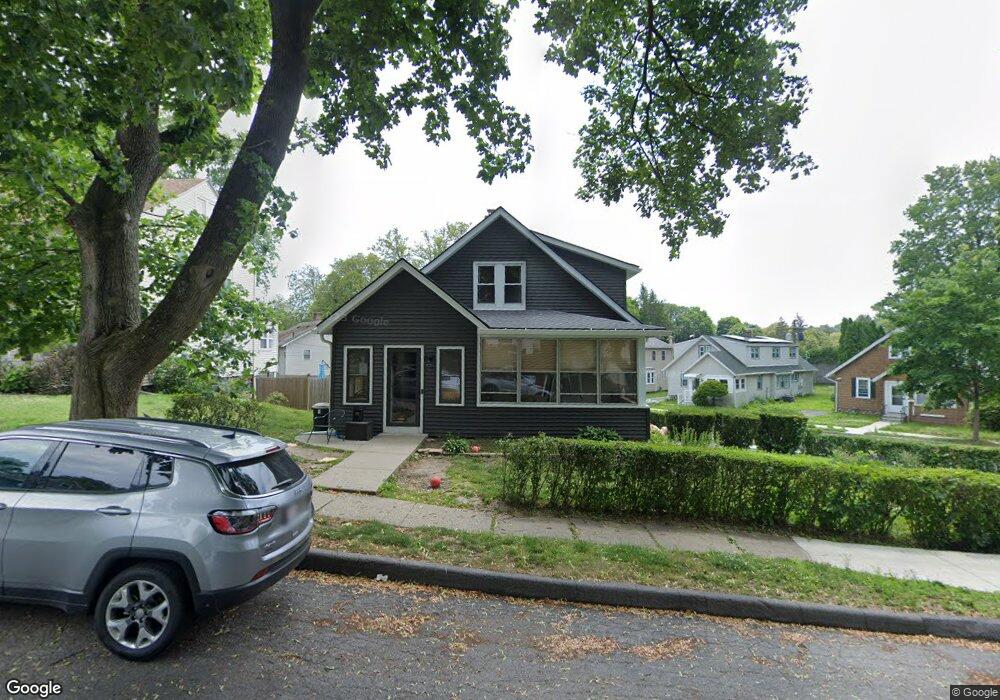
45 Berkmans St Worcester, MA 01602
Elm Park NeighborhoodEstimated Value: $410,000 - $439,000
3
Beds
1
Bath
1,620
Sq Ft
$264/Sq Ft
Est. Value
About This Home
This home is located at 45 Berkmans St, Worcester, MA 01602 and is currently estimated at $428,241, approximately $264 per square foot. 45 Berkmans St is a home located in Worcester County with nearby schools including Chandler Magnet, Jacob Hiatt Magnet School, and Midland Street.
Ownership History
Date
Name
Owned For
Owner Type
Purchase Details
Closed on
Jan 23, 2015
Sold by
Broderick Michael
Bought by
Oleary John and Oleary Alicia A
Current Estimated Value
Home Financials for this Owner
Home Financials are based on the most recent Mortgage that was taken out on this home.
Original Mortgage
$138,700
Outstanding Balance
$100,869
Interest Rate
3%
Mortgage Type
Adjustable Rate Mortgage/ARM
Estimated Equity
$327,372
Create a Home Valuation Report for This Property
The Home Valuation Report is an in-depth analysis detailing your home's value as well as a comparison with similar homes in the area
Home Values in the Area
Average Home Value in this Area
Purchase History
We collect this data history from publicly available records. To have your information removed, we recommend requesting removal directly through your county’s website.
| Date | Buyer | Sale Price | Title Company |
|---|---|---|---|
| Oleary John | $158,000 | -- |
Source: Public Records
Mortgage History
We collect this data history from publicly available records. To have your information removed, we recommend requesting removal directly through your county’s website.
| Date | Status | Borrower | Loan Amount |
|---|---|---|---|
| Open | Oleary John | $138,700 |
Source: Public Records
Tax History
| Year | Tax Paid | Tax Assessment Tax Assessment Total Assessment is a certain percentage of the fair market value that is determined by local assessors to be the total taxable value of land and additions on the property. | Land | Improvement |
|---|---|---|---|---|
| 2025 | $4,839 | $366,900 | $117,400 | $249,500 |
| 2024 | $4,645 | $337,800 | $117,400 | $220,400 |
| 2023 | $4,454 | $310,600 | $102,100 | $208,500 |
| 2022 | $4,091 | $269,000 | $81,700 | $187,300 |
| 2021 | $4,031 | $247,600 | $65,300 | $182,300 |
| 2020 | $3,842 | $226,000 | $65,300 | $160,700 |
| 2019 | $3,692 | $205,100 | $58,800 | $146,300 |
| 2018 | $3,689 | $195,100 | $58,800 | $136,300 |
| 2017 | $3,535 | $183,900 | $58,800 | $125,100 |
| 2016 | $3,481 | $168,900 | $42,700 | $126,200 |
| 2015 | $3,390 | $168,900 | $42,700 | $126,200 |
| 2014 | $3,300 | $168,900 | $42,700 | $126,200 |
Source: Public Records
Map
Nearby Homes
- 47 Carlisle St
- 14 Hadwen Rd
- 22 Longfellow Rd
- 108 Longfellow Rd
- 4 Longfellow Rd
- 5 Franconia St
- 3 Franconia St
- 71 Morningside Rd
- 4 Hamill Rd
- 12 Sherwood Rd
- 113 May St
- 4 Howland Terrace
- 10 Minthorne St
- 14 Saint Elmo Rd
- 440 Park Ave
- 4 Chamberlain Pkwy
- 109 S Flagg St
- 114 Lovell St
- 26 Winifred Ave
- 72 Mason St
Your Personal Tour Guide
Ask me questions while you tour the home.