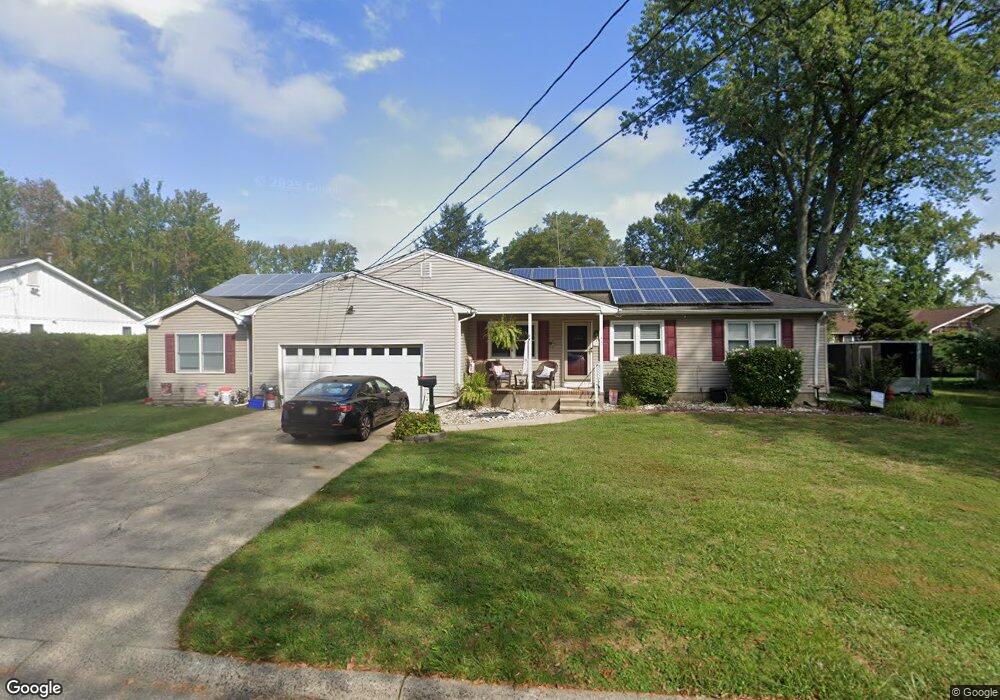
45 Bradley Ave Oceanport, NJ 07757
Estimated Value: $867,000 - $983,000
5
Beds
2
Baths
2,258
Sq Ft
$401/Sq Ft
Est. Value
About This Home
This home is located at 45 Bradley Ave, Oceanport, NJ 07757 and is currently estimated at $905,727, approximately $401 per square foot. 45 Bradley Ave is a home located in Monmouth County with nearby schools including Wolf Hill Elementary School, Maple Place Elementary and Middle School, and Shore Regional High School.
Ownership History
Date
Name
Owned For
Owner Type
Purchase Details
Closed on
Aug 19, 2020
Sold by
Gallo James and Gallo Diane
Bought by
Gallo James and Gallo Diane
Current Estimated Value
Home Financials for this Owner
Home Financials are based on the most recent Mortgage that was taken out on this home.
Original Mortgage
$357,500
Interest Rate
2.8%
Mortgage Type
New Conventional
Purchase Details
Closed on
Jan 2, 1909
Sold by
Fusco Louis
Bought by
Gallo James and Gallo Diane
Home Financials for this Owner
Home Financials are based on the most recent Mortgage that was taken out on this home.
Original Mortgage
$164,550
Interest Rate
6.65%
Mortgage Type
FHA
Create a Home Valuation Report for This Property
The Home Valuation Report is an in-depth analysis detailing your home's value as well as a comparison with similar homes in the area
Home Values in the Area
Average Home Value in this Area
Purchase History
| Date | Buyer | Sale Price | Title Company |
|---|---|---|---|
| Gallo James | -- | Signature Setmnt Svcs Agcy L | |
| Gallo James | -- | Signature Settlement & Title | |
| Gallo James | $5,018,800 | -- |
Source: Public Records
Mortgage History
| Date | Status | Borrower | Loan Amount |
|---|---|---|---|
| Previous Owner | Gallo James | $357,500 | |
| Previous Owner | Gallo James | $397,500 | |
| Previous Owner | Gallo James | $164,550 |
Source: Public Records
Tax History Compared to Growth
Tax History
| Year | Tax Paid | Tax Assessment Tax Assessment Total Assessment is a certain percentage of the fair market value that is determined by local assessors to be the total taxable value of land and additions on the property. | Land | Improvement |
|---|---|---|---|---|
| 2025 | $9,547 | $701,200 | $435,000 | $266,200 |
| 2024 | $9,683 | $604,600 | $350,000 | $254,600 |
| 2023 | $9,683 | $581,900 | $340,000 | $241,900 |
| 2022 | $9,192 | $503,000 | $290,000 | $213,000 |
| 2021 | $9,192 | $482,500 | $280,000 | $202,500 |
| 2020 | $8,484 | $464,100 | $265,000 | $199,100 |
| 2019 | $8,142 | $452,100 | $260,000 | $192,100 |
| 2018 | $8,047 | $449,800 | $260,000 | $189,800 |
| 2017 | $7,472 | $346,400 | $158,000 | $188,400 |
| 2016 | $7,391 | $344,900 | $160,000 | $184,900 |
| 2015 | $7,054 | $340,100 | $160,000 | $180,100 |
| 2014 | $7,153 | $349,800 | $190,000 | $159,800 |
Source: Public Records
Map
Nearby Homes
- 10 Asbury Ave
- 265 Port Au Peck Ave
- 3 Foggia Way
- 66 Shrewsbury Ave
- 13 Morris Place
- 14 Oceanport Ave
- 94 Paddock Ct
- 1 Carriage House Ln
- 15 Signal Ave
- 238 Branchport Ave
- 572 Jay St
- 11 Clay St
- 565 Joline Ave
- 222 Coleman Ave
- 8 Pocahontas Ave
- 3 Sandbar Aly
- 631 Irving Place
- 401 Joline Ave
- 190 Spruce St Unit 4
- 7 Linden Ave