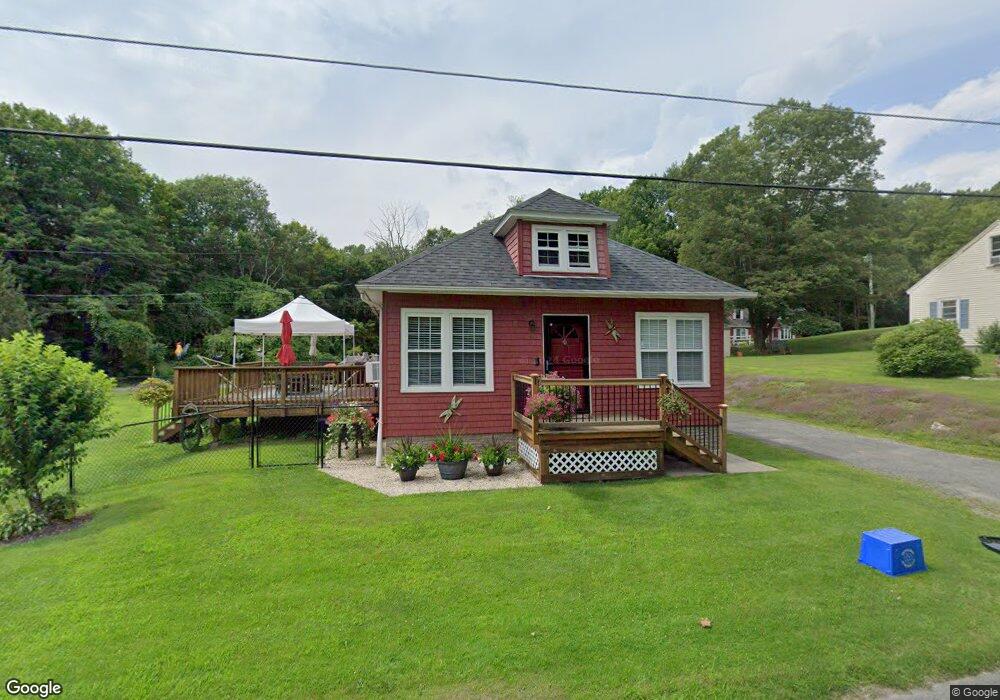
45 Bromback St Pittsfield, MA 01201
Estimated Value: $214,000 - $329,000
2
Beds
1
Bath
912
Sq Ft
$285/Sq Ft
Est. Value
About This Home
This home is located at 45 Bromback St, Pittsfield, MA 01201 and is currently estimated at $259,667, approximately $284 per square foot. 45 Bromback St is a home located in Berkshire County with nearby schools including Robert T. Capeless Elementary School, John T. Reid Middle School, and Taconic High School.
Ownership History
Date
Name
Owned For
Owner Type
Purchase Details
Closed on
May 9, 2007
Sold by
Walger Eric J
Bought by
Walger Eric J and Walger Tammy L
Current Estimated Value
Purchase Details
Closed on
May 30, 1997
Sold by
Fhlmc
Bought by
Walger Eric J
Purchase Details
Closed on
Mar 13, 1997
Sold by
Wheeler Rose and Nationsbanc Mtg Corp
Bought by
Fhlmc
Create a Home Valuation Report for This Property
The Home Valuation Report is an in-depth analysis detailing your home's value as well as a comparison with similar homes in the area
Home Values in the Area
Average Home Value in this Area
Purchase History
| Date | Buyer | Sale Price | Title Company |
|---|---|---|---|
| Walger Eric J | -- | -- | |
| Walger Eric J | -- | -- | |
| Walger Eric J | -- | -- | |
| Walger Eric J | $34,900 | -- | |
| Walger Eric J | $34,900 | -- | |
| Fhlmc | $49,632 | -- | |
| Fhlmc | $49,632 | -- |
Source: Public Records
Mortgage History
| Date | Status | Borrower | Loan Amount |
|---|---|---|---|
| Previous Owner | Fhlmc | $59,100 |
Source: Public Records
Tax History Compared to Growth
Tax History
| Year | Tax Paid | Tax Assessment Tax Assessment Total Assessment is a certain percentage of the fair market value that is determined by local assessors to be the total taxable value of land and additions on the property. | Land | Improvement |
|---|---|---|---|---|
| 2025 | $3,667 | $204,400 | $65,700 | $138,700 |
| 2024 | $3,389 | $183,700 | $65,700 | $118,000 |
| 2023 | $3,080 | $168,100 | $60,700 | $107,400 |
| 2022 | $2,842 | $153,100 | $58,200 | $94,900 |
| 2021 | $2,466 | $128,100 | $58,200 | $69,900 |
| 2020 | $2,478 | $125,700 | $58,200 | $67,500 |
| 2019 | $2,167 | $111,600 | $52,700 | $58,900 |
| 2018 | $1,985 | $99,200 | $52,700 | $46,500 |
| 2017 | $1,875 | $95,500 | $50,700 | $44,800 |
| 2016 | $1,829 | $97,500 | $50,700 | $46,800 |
| 2015 | $1,761 | $97,500 | $50,700 | $46,800 |
Source: Public Records
Map
Nearby Homes