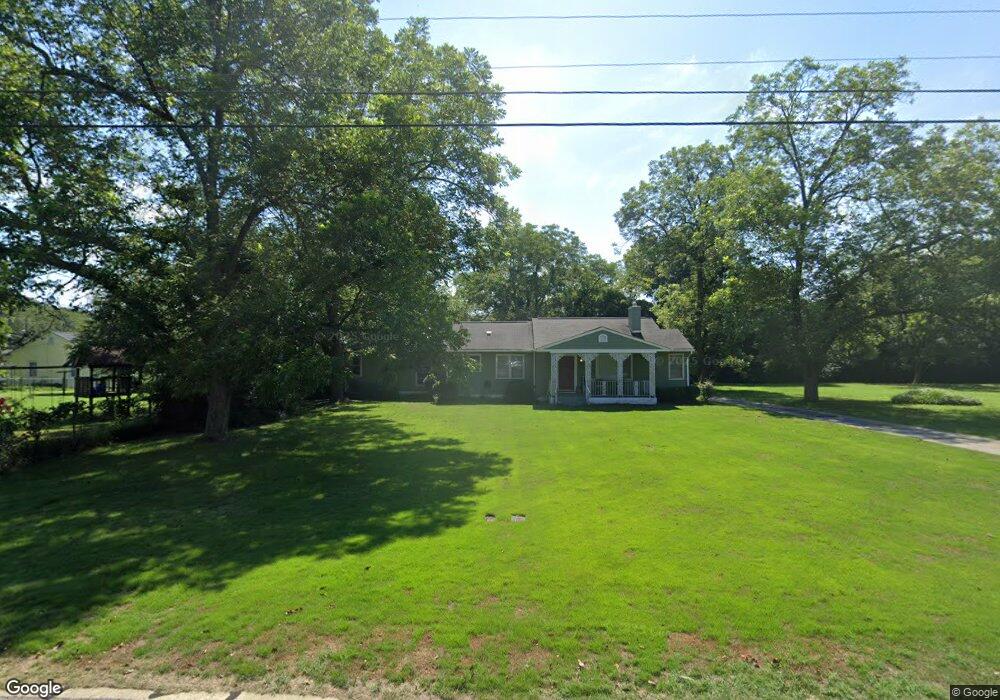
45 Brown St Hartwell, GA 30643
Estimated Value: $277,189 - $320,000
3
Beds
2
Baths
2,365
Sq Ft
$125/Sq Ft
Est. Value
About This Home
This home is located at 45 Brown St, Hartwell, GA 30643 and is currently estimated at $296,297, approximately $125 per square foot. 45 Brown St is a home located in Hart County with nearby schools including Hart County High School, Barnes Academy, and Hartwell Mennonite School.
Ownership History
Date
Name
Owned For
Owner Type
Purchase Details
Closed on
Oct 13, 2020
Sold by
Burch Joe Cobb
Bought by
Kesler Emilee Rose and Adams Zachary Taylor
Current Estimated Value
Home Financials for this Owner
Home Financials are based on the most recent Mortgage that was taken out on this home.
Original Mortgage
$159,595
Outstanding Balance
$141,692
Interest Rate
2.8%
Mortgage Type
New Conventional
Estimated Equity
$154,605
Purchase Details
Closed on
Dec 18, 2012
Sold by
Richie Martha J
Bought by
Burch Joe Cobb
Home Financials for this Owner
Home Financials are based on the most recent Mortgage that was taken out on this home.
Original Mortgage
$43,204
Interest Rate
3.35%
Mortgage Type
New Conventional
Purchase Details
Closed on
Aug 31, 2010
Sold by
Johnson Louise Cobb
Bought by
Richie Martha J
Purchase Details
Closed on
Feb 1, 1949
Create a Home Valuation Report for This Property
The Home Valuation Report is an in-depth analysis detailing your home's value as well as a comparison with similar homes in the area
Home Values in the Area
Average Home Value in this Area
Purchase History
| Date | Buyer | Sale Price | Title Company |
|---|---|---|---|
| Kesler Emilee Rose | $158,000 | -- | |
| Burch Joe Cobb | $50,000 | -- | |
| Richie Martha J | -- | -- | |
| -- | -- | -- |
Source: Public Records
Mortgage History
| Date | Status | Borrower | Loan Amount |
|---|---|---|---|
| Open | Kesler Emilee Rose | $159,595 | |
| Previous Owner | Burch Joe Cobb | $43,204 |
Source: Public Records
Tax History Compared to Growth
Tax History
| Year | Tax Paid | Tax Assessment Tax Assessment Total Assessment is a certain percentage of the fair market value that is determined by local assessors to be the total taxable value of land and additions on the property. | Land | Improvement |
|---|---|---|---|---|
| 2024 | $1,976 | $81,825 | $16,800 | $65,025 |
| 2023 | $1,907 | $73,589 | $16,800 | $56,789 |
| 2022 | $1,089 | $65,420 | $14,000 | $51,420 |
| 2021 | $1,107 | $59,658 | $14,000 | $45,658 |
| 2020 | $970 | $50,101 | $14,000 | $36,101 |
| 2019 | $964 | $49,327 | $14,000 | $35,327 |
| 2018 | $967 | $48,907 | $12,000 | $36,907 |
| 2017 | $964 | $48,499 | $12,000 | $36,499 |
| 2016 | $1,007 | $49,072 | $12,000 | $37,072 |
| 2015 | $915 | $47,013 | $10,000 | $37,013 |
| 2014 | $966 | $48,614 | $12,800 | $35,814 |
| 2013 | -- | $43,096 | $12,800 | $30,296 |
Source: Public Records
Map
Nearby Homes
- 169 Brown St
- 72 Cade St
- 183 Athens St
- 638 Highland Ave
- 656 Highland Ave Unit LOT 5
- 0 Holly St Unit 10595836
- 783 Athens St
- 62 Atlanta Ave
- 45 Dogwood St
- 651 S Jackson St
- 34 Depot St Unit 25
- 34 Depot St Unit 21
- 34 Depot St Unit 22
- 34 Depot St Unit 23
- 34 Depot St Unit 24
- 34 Depot Unit 22 St
- 34 Depot Unit 25 St
- 34 Depot Unit 23 St
- 34 Depot Unit 21 St
- 34 Depot Unit 24 St