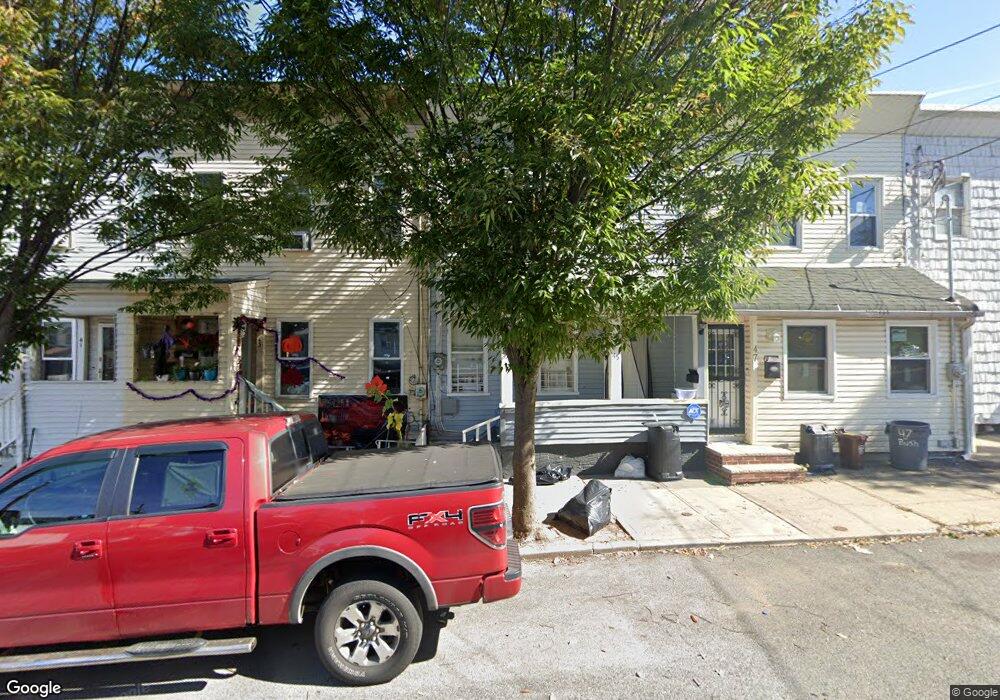
45 Bush Ave Staten Island, NY 10303
Mariners Harbor NeighborhoodEstimated Value: $427,000 - $475,000
3
Beds
2
Baths
936
Sq Ft
$487/Sq Ft
Est. Value
About This Home
This home is located at 45 Bush Ave, Staten Island, NY 10303 and is currently estimated at $456,018, approximately $487 per square foot. 45 Bush Ave is a home located in Richmond County with nearby schools including P.S. 44 Thomas C Brown, I.S. 51 Edwin Markham, and Port Richmond High School.
Ownership History
Date
Name
Owned For
Owner Type
Purchase Details
Closed on
Feb 26, 2004
Sold by
All Star Homes Inc
Bought by
Samlal Nalini
Current Estimated Value
Home Financials for this Owner
Home Financials are based on the most recent Mortgage that was taken out on this home.
Original Mortgage
$155,400
Interest Rate
7.55%
Mortgage Type
Purchase Money Mortgage
Purchase Details
Closed on
Sep 10, 2003
Sold by
Shamshudeen Hamishan and Shamshudeen Fidda J
Bought by
Allstar Homes Inc
Purchase Details
Closed on
Jan 19, 1998
Sold by
Ahmad Imtiaz and Ahmad Tasneem
Bought by
Shamshudeen Hamishan and Shamshudeen Fidda J
Home Financials for this Owner
Home Financials are based on the most recent Mortgage that was taken out on this home.
Original Mortgage
$80,950
Interest Rate
7.02%
Purchase Details
Closed on
Dec 26, 1995
Sold by
Fgb Realty Advisors Inc
Bought by
Ahmad Imtiaz and Ahmad Tasneem
Create a Home Valuation Report for This Property
The Home Valuation Report is an in-depth analysis detailing your home's value as well as a comparison with similar homes in the area
Home Values in the Area
Average Home Value in this Area
Purchase History
| Date | Buyer | Sale Price | Title Company |
|---|---|---|---|
| Samlal Nalini | $194,250 | -- | |
| Allstar Homes Inc | $110,000 | Lawyers Title Insurance Corp | |
| Shamshudeen Hamishan | $83,500 | -- | |
| Ahmad Imtiaz | $35,000 | -- |
Source: Public Records
Mortgage History
| Date | Status | Borrower | Loan Amount |
|---|---|---|---|
| Previous Owner | Samlal Nalini | $155,400 | |
| Previous Owner | Shamshudeen Hamishan | $80,950 |
Source: Public Records
Tax History Compared to Growth
Tax History
| Year | Tax Paid | Tax Assessment Tax Assessment Total Assessment is a certain percentage of the fair market value that is determined by local assessors to be the total taxable value of land and additions on the property. | Land | Improvement |
|---|---|---|---|---|
| 2025 | $1,812 | $23,400 | $2,053 | $21,347 |
| 2024 | $1,812 | $19,860 | $2,290 | $17,570 |
| 2023 | $1,746 | $8,598 | $1,995 | $6,603 |
| 2022 | $1,681 | $21,300 | $5,040 | $16,260 |
| 2021 | $1,673 | $20,700 | $5,040 | $15,660 |
| 2020 | $2,150 | $17,880 | $5,040 | $12,840 |
| 2019 | $2,042 | $18,660 | $5,040 | $13,620 |
| 2018 | $1,461 | $7,165 | $2,583 | $4,582 |
| 2017 | $1,430 | $7,015 | $2,631 | $4,384 |
| 2016 | $1,325 | $6,626 | $2,541 | $4,085 |
| 2015 | $1,203 | $6,618 | $2,808 | $3,810 |
| 2014 | $1,203 | $6,267 | $2,261 | $4,006 |
Source: Public Records
Map
Nearby Homes
- 13 Coonley Ct
- 42 Union Ave
- 99 Union Ave
- 36 Lockman Ave
- 101 Lockman Ave
- 43 Andros Ave
- 136 Union Ave
- 138 Union Ave
- 140 Union Ave
- 34 Andros Ave
- 51 Mersereau Ave
- 167 Harbor Rd
- 113 Van Pelt Ave
- 64 van Name Ave
- 133 Van Pelt Ave
- 186 Union Ave
- 11 van Name Ave
- 16 Mersereau Ave
- 113 Grandview Ave
- 123 Mariners Ln