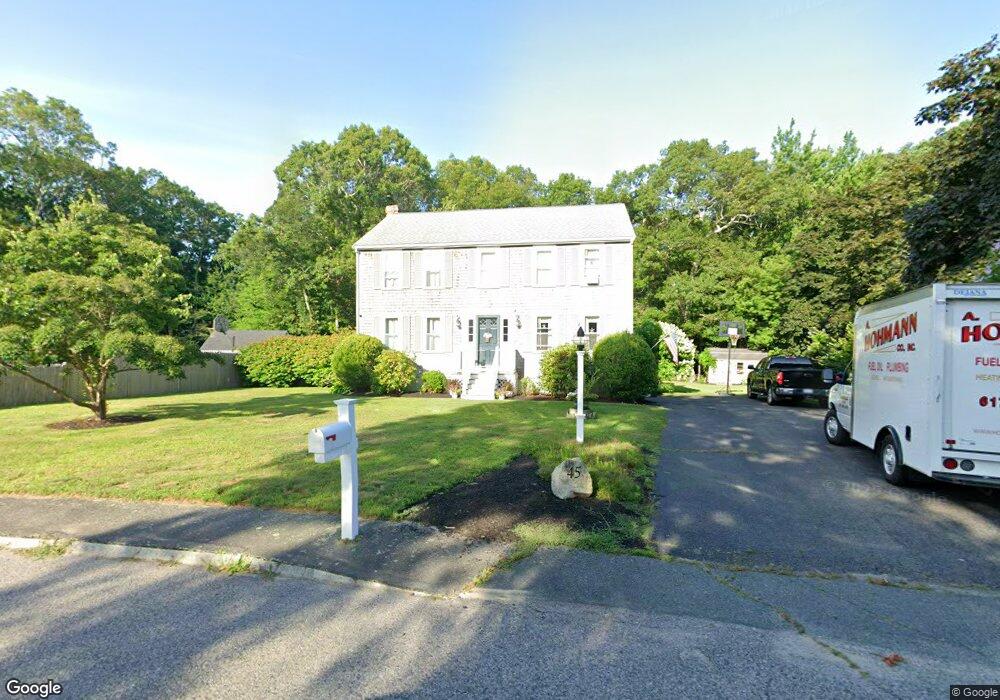
45 Calypso Ln Marshfield, MA 02050
Green Harbor-Cedar Crest NeighborhoodEstimated Value: $694,000 - $834,000
5
Beds
2
Baths
2,176
Sq Ft
$353/Sq Ft
Est. Value
About This Home
This home is located at 45 Calypso Ln, Marshfield, MA 02050 and is currently estimated at $768,055, approximately $352 per square foot. 45 Calypso Ln is a home located in Plymouth County with nearby schools including Governor Edward Winslow School, Furnace Brook Middle School, and Marshfield High School.
Ownership History
Date
Name
Owned For
Owner Type
Purchase Details
Closed on
Apr 27, 2006
Sold by
Conley Joan
Bought by
King Joseph T and King Heather D
Current Estimated Value
Home Financials for this Owner
Home Financials are based on the most recent Mortgage that was taken out on this home.
Original Mortgage
$82,000
Interest Rate
6.62%
Purchase Details
Closed on
Apr 18, 1991
Sold by
Windjammer Rt
Bought by
Conley Richard S and Conley Joan
Create a Home Valuation Report for This Property
The Home Valuation Report is an in-depth analysis detailing your home's value as well as a comparison with similar homes in the area
Home Values in the Area
Average Home Value in this Area
Purchase History
| Date | Buyer | Sale Price | Title Company |
|---|---|---|---|
| King Joseph T | $410,000 | -- | |
| King Joseph T | $410,000 | -- | |
| Conley Richard S | $173,000 | -- |
Source: Public Records
Mortgage History
| Date | Status | Borrower | Loan Amount |
|---|---|---|---|
| Open | Conley Richard S | $450,000 | |
| Closed | Conley Richard S | $82,000 |
Source: Public Records
Tax History
| Year | Tax Paid | Tax Assessment Tax Assessment Total Assessment is a certain percentage of the fair market value that is determined by local assessors to be the total taxable value of land and additions on the property. | Land | Improvement |
|---|---|---|---|---|
| 2025 | $6,373 | $643,700 | $299,300 | $344,400 |
| 2024 | $6,233 | $599,900 | $285,100 | $314,800 |
| 2023 | $5,787 | $527,800 | $254,500 | $273,300 |
| 2022 | $5,787 | $446,900 | $213,800 | $233,100 |
| 2021 | $5,573 | $422,500 | $213,800 | $208,700 |
| 2020 | $5,280 | $396,100 | $193,500 | $202,600 |
| 2019 | $5,135 | $383,800 | $193,500 | $190,300 |
| 2018 | $5,117 | $382,700 | $193,500 | $189,200 |
| 2017 | $5,089 | $370,900 | $193,500 | $177,400 |
| 2016 | $4,972 | $358,200 | $193,500 | $164,700 |
| 2015 | $4,703 | $353,900 | $193,500 | $160,400 |
| 2014 | $4,654 | $350,200 | $193,500 | $156,700 |
Source: Public Records
Map
Nearby Homes
- 245 Careswell St
- 56 Lincoln Ave
- 238 Atwell Cir
- 98 Cherry St
- 68 Leland Rd
- 585 Careswell St
- 36 Ocean St
- 308 Ocean St
- 99 Ashburton Ave
- 130 Winslow Cemetery Rd
- 36 Ocean Rd N
- 13 Lewis Ct
- 95 Blackmount Dr
- 25 11th Rd
- 51 Meetinghouse Ln
- 1221 Ocean St
- 555 Webster St
- 1 Old Pilgrim Trail
- 42 Carr Rd
- 91 Winslow St
Your Personal Tour Guide
Ask me questions while you tour the home.