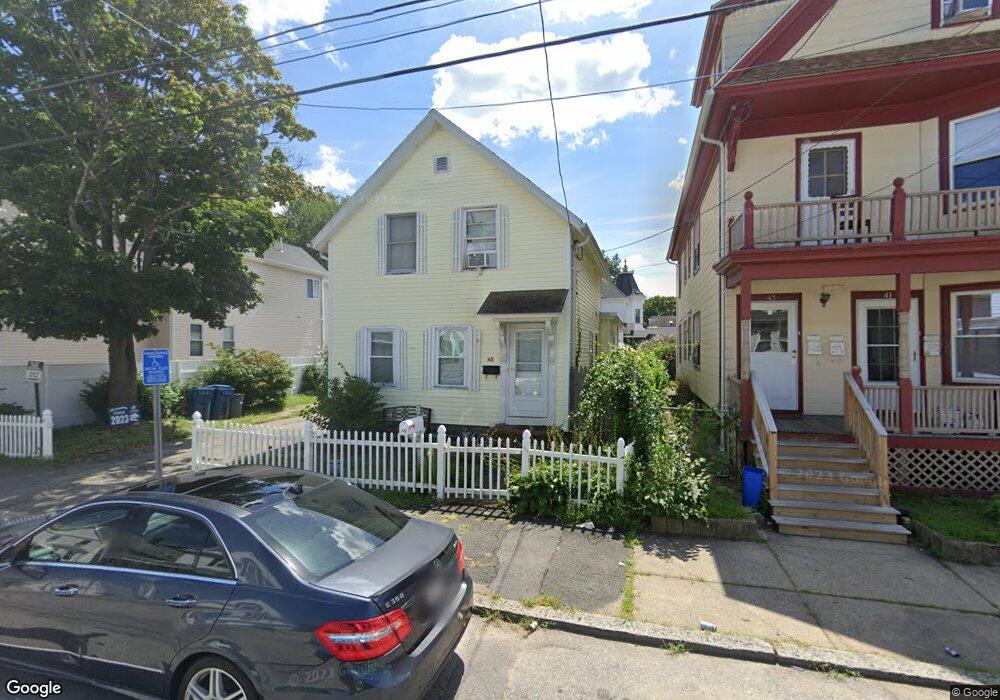
45 Cambridge St Lawrence, MA 01843
South Common NeighborhoodEstimated Value: $392,000 - $534,000
2
Beds
1
Bath
1,510
Sq Ft
$302/Sq Ft
Est. Value
About This Home
This home is located at 45 Cambridge St, Lawrence, MA 01843 and is currently estimated at $456,550, approximately $302 per square foot. 45 Cambridge St is a home located in Essex County with nearby schools including John Breen School, South Lawrence East Elementary School, and School For Exceptional Studies.
Ownership History
Date
Name
Owned For
Owner Type
Purchase Details
Closed on
Nov 16, 2016
Sold by
David Terburgh
Bought by
Mathes Ralph
Current Estimated Value
Home Financials for this Owner
Home Financials are based on the most recent Mortgage that was taken out on this home.
Original Mortgage
$161,250
Outstanding Balance
$130,065
Interest Rate
3.57%
Estimated Equity
$326,485
Purchase Details
Closed on
Feb 17, 2005
Sold by
Chea Nhak and Chea Sakith Sochhin
Bought by
Terburgh David
Home Financials for this Owner
Home Financials are based on the most recent Mortgage that was taken out on this home.
Original Mortgage
$150,000
Interest Rate
5.78%
Mortgage Type
Purchase Money Mortgage
Purchase Details
Closed on
Jul 24, 1989
Sold by
Wilt Michael J
Bought by
Chea Nhak
Home Financials for this Owner
Home Financials are based on the most recent Mortgage that was taken out on this home.
Original Mortgage
$78,000
Interest Rate
10.07%
Mortgage Type
Purchase Money Mortgage
Create a Home Valuation Report for This Property
The Home Valuation Report is an in-depth analysis detailing your home's value as well as a comparison with similar homes in the area
Home Values in the Area
Average Home Value in this Area
Purchase History
| Date | Buyer | Sale Price | Title Company |
|---|---|---|---|
| Mathes Ralph | -- | -- | |
| Terburgh David | $207,500 | -- | |
| Chea Nhak | $101,000 | -- |
Source: Public Records
Mortgage History
| Date | Status | Borrower | Loan Amount |
|---|---|---|---|
| Open | Chea Nhak | $161,250 | |
| Closed | Chea Nhak | -- | |
| Previous Owner | Chea Nhak | $174,800 | |
| Previous Owner | Terburgh David | $150,000 | |
| Previous Owner | Chea Nhak | $70,400 | |
| Previous Owner | Chea Nhak | $78,000 |
Source: Public Records
Tax History
| Year | Tax Paid | Tax Assessment Tax Assessment Total Assessment is a certain percentage of the fair market value that is determined by local assessors to be the total taxable value of land and additions on the property. | Land | Improvement |
|---|---|---|---|---|
| 2025 | $3,355 | $381,200 | $103,400 | $277,800 |
| 2024 | $3,190 | $344,900 | $111,900 | $233,000 |
| 2023 | $3,296 | $324,400 | $103,800 | $220,600 |
| 2022 | $3,099 | $270,900 | $94,100 | $176,800 |
| 2021 | $3,022 | $246,300 | $94,100 | $152,200 |
| 2020 | $2,797 | $225,000 | $89,200 | $135,800 |
| 2019 | $2,948 | $215,500 | $74,100 | $141,400 |
| 2018 | $2,715 | $189,600 | $70,200 | $119,400 |
| 2017 | $2,562 | $167,000 | $66,300 | $100,700 |
| 2016 | $2,423 | $156,200 | $54,600 | $101,600 |
| 2015 | $2,362 | $156,200 | $54,600 | $101,600 |
Source: Public Records
Map
Nearby Homes
- 46-46A Dorchester St
- 27-29 Dorchester St
- 356-360 S Union St
- 31 Garfield St
- 183 Farnham St Unit 189
- 119 Andover St
- 161-167 S Union St
- 91-93 Andover St
- 151-153 Bailey St
- 100 Bailey St Unit 1
- 100 Bailey St Unit 3
- 341 S Broadway- Parcel II
- 24 Inman St Unit 4
- 87-87A Brookfield St
- 49 Bowdoin St Unit 51
- 82 S Broadway
- 43 Gorham St
- 91-93 Newton St
- 11 W Hawley St
- 12B Stevens St
- 41 Cambridge St Unit 43
- 41 Cambridge St Unit 2
- 53 Cambridge St
- 43 Cambridge St
- 34 Dorchester St
- 36 Winthrop Ave
- 55 Cambridge St Unit 57
- 48 Cambridge St Unit 50
- 44 Dorchester St
- 48-50 Cambridge St
- 44 Cambridge St Unit 46
- 54 Cambridge St Unit 56
- 52 Cambridge St
- 59 Cambridge St Unit 61
- 40-42 Cambridge St
- 40 Cambridge St Unit 42
- 46-46A Dorcheter
- 46 Dorchester St Unit 46A
- 46-4 Dorchester St
- 54-56 Cambridge St
Your Personal Tour Guide
Ask me questions while you tour the home.