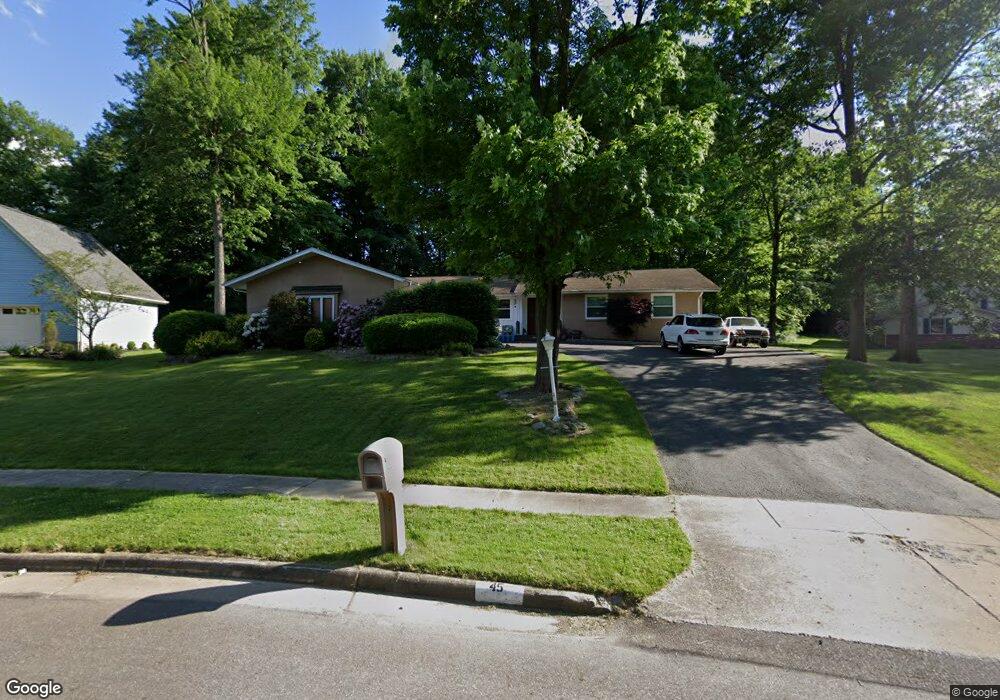
45 Camelot Ct Canfield, OH 44406
Estimated Value: $354,000 - $395,000
4
Beds
3
Baths
2,336
Sq Ft
$158/Sq Ft
Est. Value
About This Home
This home is located at 45 Camelot Ct, Canfield, OH 44406 and is currently estimated at $369,465, approximately $158 per square foot. 45 Camelot Ct is a home located in Mahoning County with nearby schools including Canfield Village Middle School and Canfield High School.
Ownership History
Date
Name
Owned For
Owner Type
Purchase Details
Closed on
Sep 22, 2023
Sold by
Zena Margaret Mary
Bought by
Zena Thomas E
Current Estimated Value
Purchase Details
Closed on
Sep 15, 2023
Sold by
Zena Family Trust
Bought by
Zena Anna
Purchase Details
Closed on
Dec 17, 1974
Bought by
Zena Margaret M
Create a Home Valuation Report for This Property
The Home Valuation Report is an in-depth analysis detailing your home's value as well as a comparison with similar homes in the area
Home Values in the Area
Average Home Value in this Area
Purchase History
| Date | Buyer | Sale Price | Title Company |
|---|---|---|---|
| Zena Thomas E | -- | -- | |
| Zena Anna | -- | None Listed On Document | |
| Zena Anna | -- | None Listed On Document | |
| Zena Margaret M | -- | -- |
Source: Public Records
Tax History Compared to Growth
Tax History
| Year | Tax Paid | Tax Assessment Tax Assessment Total Assessment is a certain percentage of the fair market value that is determined by local assessors to be the total taxable value of land and additions on the property. | Land | Improvement |
|---|---|---|---|---|
| 2024 | $4,182 | $97,030 | $16,100 | $80,930 |
| 2023 | $4,115 | $97,030 | $16,100 | $80,930 |
| 2022 | $4,369 | $81,970 | $13,570 | $68,400 |
| 2021 | $4,240 | $81,970 | $13,570 | $68,400 |
| 2020 | $4,257 | $81,970 | $13,570 | $68,400 |
| 2019 | $3,975 | $69,470 | $11,500 | $57,970 |
| 2018 | $4,535 | $69,470 | $11,500 | $57,970 |
| 2017 | $3,923 | $69,470 | $11,500 | $57,970 |
| 2016 | $3,633 | $65,530 | $11,500 | $54,030 |
| 2015 | $3,553 | $65,530 | $11,500 | $54,030 |
| 2014 | $3,568 | $65,530 | $11,500 | $54,030 |
| 2013 | $3,438 | $65,530 | $11,500 | $54,030 |
Source: Public Records
Map
Nearby Homes
- 675 Blueberry Hill Dr
- 520 Stoneybrook Ln
- 755 Blueberry Hill Dr
- 365 Sleepy Hollow Dr
- 830 Blueberry Hill Dr
- 6264 Herbert Rd
- 230 Deer Trail Ave
- 90 Villa Theresa Ln
- 30 Villa Theresa Ln
- 31 Villa Theresa Ln
- 20 Villa Theresa Ln
- 9 Willow Way
- 21 Villa Theresa Ln
- 10 Villa Theresa Ln
- 331 Verdant Ln
- 395 N Broad St
- 191 Saybrook Dr
- 301 Timber Run Dr
- 0 Lake Wobegon Dr Unit 5104965
- 0 Lake Wobegon Dr Unit 5104960
- 51 Camelot Ct
- 35 Camelot Ct
- 605 Hickory Hollow Dr
- 25 Camelot Ct
- 20 Camelot Ct
- 30 White Oak Ct
- 590 Hickory Hollow Dr
- 59 Camelot Ct
- 40 Camelot Ct
- 595 Hickory Hollow Dr
- 281 Sawmill Run Dr
- 40 White Oak Ct
- 705 Blueberry Hill Dr
- 289 Sawmill Run Dr
- 50 Camelot Ct
- 273 Sawmill Run Dr
- 65 Camelot Ct
- 60 Camelot Ct
- 585 Hickory Hollow Dr
- 265 Sawmill Run Dr