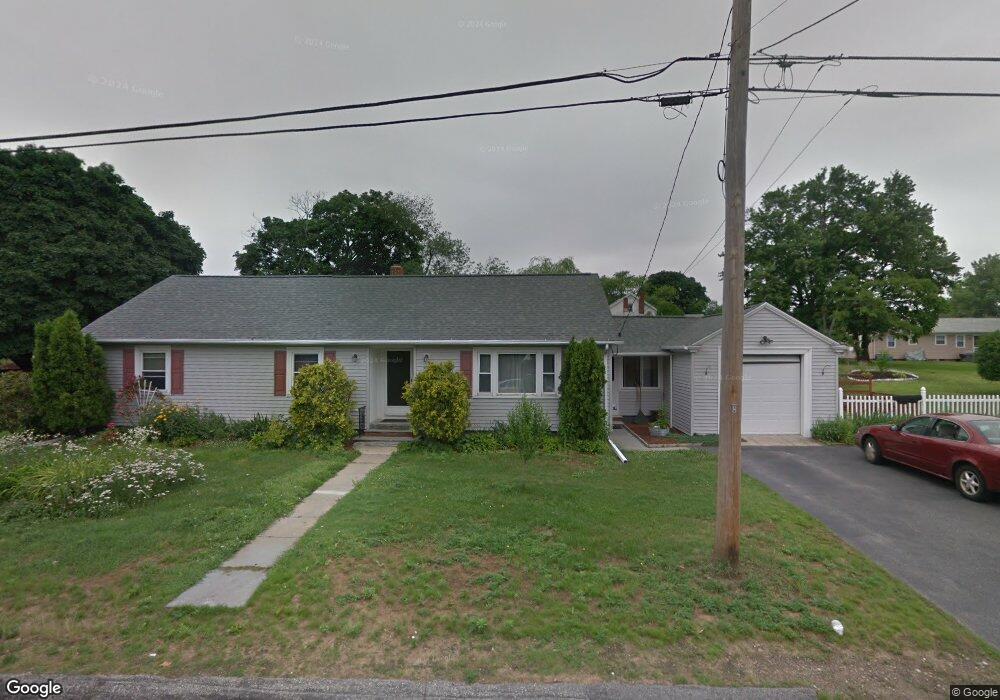
45 Cedar St Johnston, RI 02919
Killingly Street NeighborhoodEstimated Value: $403,000 - $495,000
3
Beds
2
Baths
1,468
Sq Ft
$303/Sq Ft
Est. Value
About This Home
This home is located at 45 Cedar St, Johnston, RI 02919 and is currently estimated at $445,427, approximately $303 per square foot. 45 Cedar St is a home located in Providence County with nearby schools including Johnston Senior High School, Achievement First Promesa, and Achievement First Providence Mayoral Academy Elementary.
Ownership History
Date
Name
Owned For
Owner Type
Purchase Details
Closed on
Jan 17, 2017
Sold by
Polion John and Polion Brenda
Bought by
Polion Brenda
Current Estimated Value
Purchase Details
Closed on
Aug 2, 1996
Sold by
Rainone Joseph
Bought by
Polion John R and Polion Brenda
Create a Home Valuation Report for This Property
The Home Valuation Report is an in-depth analysis detailing your home's value as well as a comparison with similar homes in the area
Home Values in the Area
Average Home Value in this Area
Purchase History
| Date | Buyer | Sale Price | Title Company |
|---|---|---|---|
| Polion Brenda | $60,000 | -- | |
| Polion John R | $105,000 | -- | |
| Polion Brenda | $60,000 | -- | |
| Polion John R | $105,000 | -- |
Source: Public Records
Mortgage History
| Date | Status | Borrower | Loan Amount |
|---|---|---|---|
| Previous Owner | Polion John R | $75,299 | |
| Previous Owner | Polion John R | $100,000 | |
| Previous Owner | Polion John R | $75,000 |
Source: Public Records
Tax History
| Year | Tax Paid | Tax Assessment Tax Assessment Total Assessment is a certain percentage of the fair market value that is determined by local assessors to be the total taxable value of land and additions on the property. | Land | Improvement |
|---|---|---|---|---|
| 2025 | $5,415 | $346,700 | $96,900 | $249,800 |
| 2024 | $5,305 | $346,700 | $96,900 | $249,800 |
| 2023 | $5,305 | $346,700 | $96,900 | $249,800 |
| 2022 | $4,135 | $222,400 | $71,700 | $150,700 |
| 2021 | $5,169 | $222,400 | $71,700 | $150,700 |
| 2018 | $4,992 | $181,600 | $53,400 | $128,200 |
| 2016 | $6,605 | $181,600 | $53,400 | $128,200 |
| 2015 | $5,204 | $179,500 | $54,700 | $124,800 |
| 2014 | $4,112 | $178,800 | $54,000 | $124,800 |
| 2013 | $5,141 | $178,800 | $54,000 | $124,800 |
Source: Public Records
Map
Nearby Homes
Your Personal Tour Guide
Ask me questions while you tour the home.