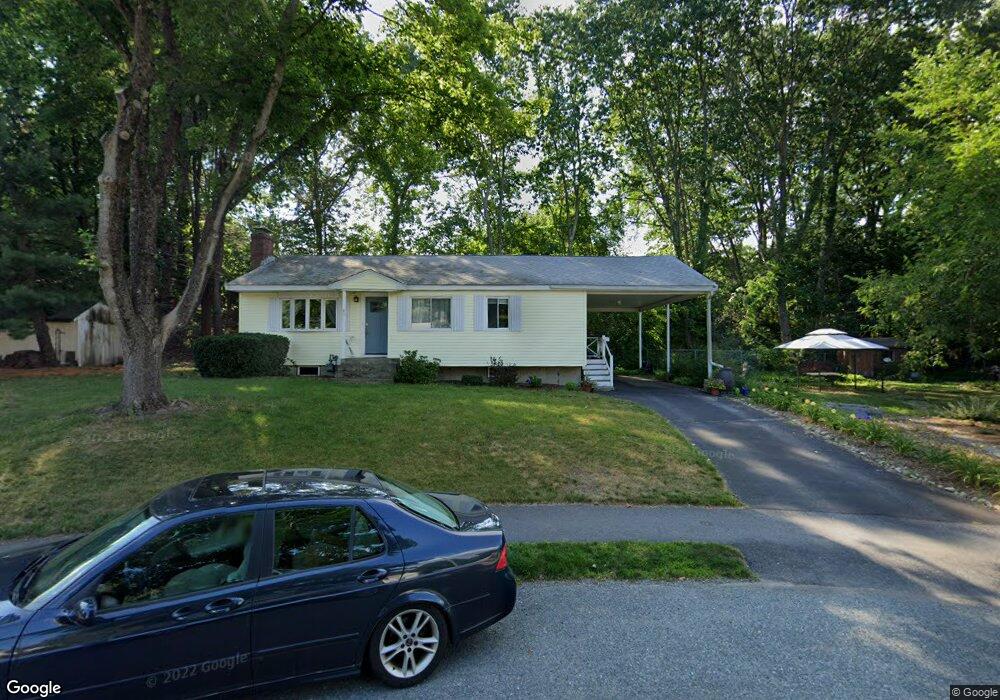
45 Centre St Natick, MA 01760
Estimated Value: $731,000 - $817,006
3
Beds
1
Bath
1,084
Sq Ft
$715/Sq Ft
Est. Value
About This Home
This home is located at 45 Centre St, Natick, MA 01760 and is currently estimated at $775,502, approximately $715 per square foot. 45 Centre St is a home located in Middlesex County with nearby schools including Natick High School, Wilson Middle School, and Bennett-Hemenway (Ben-Hem) Elementary School.
Ownership History
Date
Name
Owned For
Owner Type
Purchase Details
Closed on
Apr 30, 2004
Sold by
Helmbrecht Todd H
Bought by
Burnell Alyce
Current Estimated Value
Purchase Details
Closed on
Sep 12, 2001
Sold by
Photrnas Judith L
Bought by
Helmbrecht Todd H
Purchase Details
Closed on
Mar 21, 1991
Sold by
Schulkind Herbert A and Schulkind Pearl
Bought by
Photenas Judith L
Create a Home Valuation Report for This Property
The Home Valuation Report is an in-depth analysis detailing your home's value as well as a comparison with similar homes in the area
Home Values in the Area
Average Home Value in this Area
Purchase History
| Date | Buyer | Sale Price | Title Company |
|---|---|---|---|
| Burnell Alyce | $335,000 | -- | |
| Helmbrecht Todd H | $287,500 | -- | |
| Photenas Judith L | $76,600 | -- |
Source: Public Records
Mortgage History
| Date | Status | Borrower | Loan Amount |
|---|---|---|---|
| Open | Photenas Judith L | $25,000 | |
| Open | Photenas Judith L | $215,000 |
Source: Public Records
Tax History
| Year | Tax Paid | Tax Assessment Tax Assessment Total Assessment is a certain percentage of the fair market value that is determined by local assessors to be the total taxable value of land and additions on the property. | Land | Improvement |
|---|---|---|---|---|
| 2025 | $7,424 | $620,700 | $437,900 | $182,800 |
| 2024 | $7,195 | $586,900 | $412,100 | $174,800 |
| 2023 | $7,168 | $567,100 | $395,500 | $171,600 |
| 2022 | $6,695 | $501,900 | $343,100 | $158,800 |
| 2021 | $7,460 | $471,600 | $322,600 | $149,000 |
| 2020 | $6,210 | $456,300 | $307,300 | $149,000 |
| 2019 | $6,691 | $456,300 | $307,300 | $149,000 |
| 2018 | $5,148 | $394,500 | $307,300 | $87,200 |
| 2017 | $6,035 | $359,700 | $274,100 | $85,600 |
| 2016 | $4,665 | $343,800 | $259,100 | $84,700 |
| 2015 | $4,656 | $336,900 | $259,100 | $77,800 |
Source: Public Records
Map
Nearby Homes
Your Personal Tour Guide
Ask me questions while you tour the home.